Abstract
This paper investigates the effectiveness of different message themes and frames in promoting support for pro-animal policies and the animal movement. In particular, we sought to answer the following research question: what is the difference, if any, between the more common “consumer” frame messaging and our proposed “civic/evolve together” frame messaging in increasing participants’ support for the animal movement? Whereas the consumer frame encourages individual action, namely diet change, the civic/evolve together frame encourages collective action, primarily through voting and policy change. Three studies were conducted, each using surveys to gauge participant attitudes toward farmed animals and support for animal-friendly policies. The first study found that messages focused on exposing the deceptive practices of the animal agriculture industry (“humane deception”) were the most effective in garnering support for subsidizing meat alternatives. The second study explored the impact of message tones, themes, and frames and found that different message themes and frames can be more effective for different audiences, also finding the “humane deception” theme to be the most universally effective. The third study employed a longitudinal design to examine the long-term effects of different message frames on attitude change. Results suggest that both the consumer and evolve together frames can positively influence attitudes towards animals and support for animal-friendly policies, but the evolve together frame may be more effective at changing attitudes over time. This research provides valuable insights into the most effective message themes and frames for promoting support for animal-friendly policies and the animal movement and highlights the importance of tailoring messages to different audiences.
Key Recommendations for Advocates
- The myth of humane meat remains a highly persuadable messaging theme. Continue to directly target the deceptive “humane” marketing practices of animal product industries.
- Shift your messaging towards the civic/political frame when appropriate. While there is a place for the consumer frame, this study supports the conclusion that advocates should begin to place more emphasis on civic change and a gradual society-wide evolution away from animal farming.
- Tailor your messaging strategies to your target audience. Our research shows that the most effective message themes, tones, and frames often differ between audiences.
- Make use of meat-eating and agriculturally-informed messengers. Participants found messengers who explicitly mentioned being meat-eaters or relating to animal agriculture in some way (ie., farmers) to be more likable and relatable.
Introduction
Research regarding effective messaging within the animal movement is becoming increasingly common, with wide-ranging subject matter.1 Grummon, Anna H., Aviva A. Musicus, Meg G. Salvia, Anne N. Thorndike, and Eric B. Rimm. 2023. “Impact of Health, Environmental, and Animal Welfare Messages Discouraging Red Meat Consumption: An Online Randomized Experiment.” Journal of the Academy of Nutrition and Dietetics 123 (3): 466-476.e26. https://doi.org/10.1016/j.jand.2022.10.007. 2 Palomo-Vélez, Gonzalo, Joshua M. Tybur, and Mark van Vugt. 2018. “Unsustainable, Unhealthy, or Disgusting? Comparing Different Persuasive Messages against Meat Consumption.” Journal of Environmental Psychology 58 (August): 63–71. https://doi.org/10.1016/j.jenvp.2018.08.002. 3 Ruzgys, Shannon, and Gary J. Pickering. 2020. “Perceptions of Cultured Meat among Youth and Messaging Strategies.” Frontiers in Sustainable Food Systems 4 (August). https://doi.org/10.3389/fsufs.2020.00122. 4 Harris, Jamie, Ali Ladak, and Maya B. Mathur. 2022. “The Effects of Exposure to Information about Animal Welfare Reforms on Animal Farming Opposition: A Randomized Experiment.” Anthrozoös 35 (6): 773–88. https://doi.org/10.1080/08927936.2022.2062868. 5 Mathur, Maya B., Jacob Peacock, David B. Reichling, Janice Nadler, Paul A. Bain, Christopher D. Gardner, and Thomas N. Robinson. 2021. “Interventions to Reduce Meat Consumption by Appealing to Animal Welfare: Meta-Analysis and Evidence-Based Recommendations.” Appetite 164 (September): 105277. https://doi.org/10.1016/j.appet.2021.105277. However, a common limitation in these studies is the overreliance on a singular metric: reducing meat consumption. Indeed, these studies frequently rely on self-reported levels of meat consumption to gauge the effectiveness of the messages tested. This indicates an overreliance on and faith in what we call the consumer frame within empirical research and does little to provide deeper insight into how these messages shift peoples’ attitudes towards farmed animals and animal agriculture more generally. This should come as no surprise, as this is the frame the greater animal rights movement currently employs most commonly in its advocacy efforts toward the general public.
The consumer frame, as we define it, calls on individuals to take action as consumers; that is, it implores people to take personal responsibility for the global atrocities animals face daily by individually decreasing their meat consumption, buying more “humanely raised” products, or going vegan.
However, we propose a new frame. The civic/evolve together frame, as we define it, underscores the importance of using our collective power as voters to make systemic change for farmed animals. It does not push for personal diet change, nor does it aim to make people feel personally responsible for fixing a deep-seated global problem. Indeed, it actively combats the feelings of powerlessness that often come with personal diet change and the futility that this ultimately brings to those sympathetic to the cause.
Based on the results from our qualitative research,6 Hamer, Eva, and Aidan Kankyoku. n.d. “Evolving Together.” Narrative.paxfauna.org. Pax Fauna. Accessed March 11, 2024. https://narrative.paxfauna.org/. which found that the evolve together frame was generally more effective than the consumer frame in garnering support for the animal movement and moving past a widely held belief in the futility of individual diet change, we sought to test how these findings would hold up to quantitative research.
Overview of Studies
Our first of three studies was primarily informed by our qualitative research, in which we ran focus groups and interviews to gain a better understanding of the effectiveness of various messages in garnering support for the animal movement. This study translated 20 of the messages that we had previously tested into op-ed form, which participants read and answered questions about.
For the second study, we decided to focus more closely on the primary goal of our research: whether the consumer or evolve together frame worked better to influence public opinion regarding the animal movement. Additionally, we sought to further test the effectiveness of some of the top-performing themes identified in our first study. Finally, we included “emotional” and “dry” tone variables to round out this 2x2x3 factorial study. Again, all variables were presented in the form of an op-ed, and participants were then surveyed using a 7-point Likert scale.
Our final study sought to expand upon our previous findings and further focus our efforts on our primary research question. To do this, we performed a multi-wave longitudinal study that measured the effectiveness of the evolve together/citizen frame compared to the more common consumer frame in positively shifting people’s views on animals and the animal freedom movement over time. Again, participants read differently-themed op-eds supporting a specific policy through separate frames before answering questions regarding their support for the policy and the greater animal movement once per week for 5 weeks.
Study 1: Narrative Theme Survey Experiment
Materials and Methods
Participants
We received 5,911 survey responses from participants recruited through Prolific, an online survey panel recruitment tool where participants were invited to participate in a 5-minute long “Narrative Survey” for $0.88. All participants were residents of the United States over the age of 18. After rejecting participants for the failure of two attention checks or otherwise returning their submissions, we were left with a total study population of 5606. Participants were either assigned to the control or one of 23 treatment groups, where the average number of participants per group was 267.
The age of the average participant in our final participant pool was 38.23, while 49.4% identified as female and 50.6% identified as male.
Procedure
Participants were instructed to “read the following excerpt from a recent article regarding an upcoming ballot measure.” They were then shown either the control op-ed, an article about a wheat harvest, or one of 20 op-ed-type articles, all of which advocated for a ballot measure designed to protect animals and promote plant-based diets by subsidizing the cost of animal-free food alternatives. However, each treatment article centered around different themes, such as the deceptiveness of “humane” meat, health, and climate change. While most messages were based on those that emerged from our qualitative research, some were included in an attempt to represent messages more commonly being used by advocates currently (as marked with an asterisk below). They were then asked a series of questions, answered on a 7-point Likert scale, and divided into three sections: policy support, messenger-likeability, and animal attitude. A short synopsis of each treatment op-ed is included below.
| Treatment | Article Messenger and Synopsis |
| Consumer/Voter Covert | A meat-eating construction worker discusses society evolving away from eating conventional animal meat. |
| Humane Deception | A “meat-lover” discusses the deception of animal product labels like “humane” and “free range.” |
| Denying Natural Behaviors | A vet tech talks about farmed animals’ natural behaviors that are denied when they are farmed. |
| Consumer/Voter Overt | A meat-eating construction worker talks about why we should act together as voters to help animals, as opposed to taking individual action. |
| Moral Issue | A teacher discusses the fact that while many people have emotional reactions to slaughterhouse footage, they actively try to not think about the plight of farmed animals. |
| Sound the Alarm | A climate change scientist discusses the negative impact that animal agriculture has on the environment. |
| Escaping the System | A former slaughterhouse worker discusses the toll that slaughtering animals for a job has on people. |
| It Starts Small | A lead petitioner emphasizes that big change can be sparked by small steps like a ballot measure. |
| How Stuff Works | A biochemist at a cow-milk-free dairy start-up discusses the process and environmental-friendliness of cultivated dairy/meat production. |
| A Better Way | A 67-year-old business owner discusses pivoting from dairy farming to cashew and oat farming. |
| Stuck in Place | A 4th-generation cattle farmer discusses the struggles of some farmers as smaller, family farms are turned into factory farms. |
| Change of Heart | A 4th-generation cattle farmer discusses the emotional toll that farming cows took on him, and his subsequent support of animal-free foods. |
| Level the Playing Field | A former city council member discusses the unfair advantage that the animal agriculture industry has because of the massive subsidies they receive from the government. |
| Evolve Together | A teacher calls for an evolution away from animal-based foods at a societal level. |
| Evolve/Adapt | A medical student discusses evolving beyond animal consumption and different cultures adapting to plant-based cooking. |
| Change is Happening* | A construction worker discusses the recent growth of the plant-based foods industry, indicating a “cultural awakening.” |
| Corporate Corruption* | An activist facing a felony prosecution for investigating a factory farm discusses the horrible actions factory farms take in the name of profit, in addition to their intimidation tactics towards anyone who tries to expose these actions. |
| Health* | A physician discusses the positive health impacts of a plant-based diet. |
| Slaughter* | A former slaughterhouse worker details the horrific process of slaughtering chickens. |
| Oppression is Connected* | A union organizer discusses the connection between the oppression of slaughterhouse workers, those living near slaughterhouses, and the animals being slaughtered themselves. |
Fig. 1: Short synopsis of each treatment group’s corresponding op-ed.
Dependent Variables
We measured four dependent variables for all treatment groups. These included their policy support score, messenger-likeability score, animal attitude score, and the average of all three scores. Scores were measured using the aforementioned 7-point Likert scale.
Analysis
Post-hoc ANOVA tests were used to analyze our data via Jamovi, a free analysis tool similar to SPSS. We focused on comparing the average scores of each treatment group to the control specifically through p-value testing. We first analyzed the results of all participants in each treatment group, and then further divided each treatment and control group into three smaller groups, based on previously scored demographic questions answered by all participants which aimed to estimate how likely they would be to support our cause. These questions included intentions to decrease meat consumption, gender, and various political affiliations (see appendix for further information). We titled these groups ‘opposition’ (n = 618), ‘persuadable’ (n = 3696) and ‘base’ (n = 1292).
Results
Average Total Score
All Participants
The average total score among all participants was found to be significantly greater, including when accounting for the Bonferroni correction, than that of the control in the following treatment groups: Humane Deception (t(5585) = -4.1050, p < 0.001, pbonferroni = 0.009) and Health (t(5585)= -3.7124, p < 0.001, pbonferroni = 0.044). The full analysis of all 23 treatment groups can be found in the table below, including the treatment groups that had significantly greater scores before accounting for the Bonferroni correction (which include Consumer/Voter Covert, Moral Issue, Better Way, Stuck in Place, Change of Heart, and Slaughter).
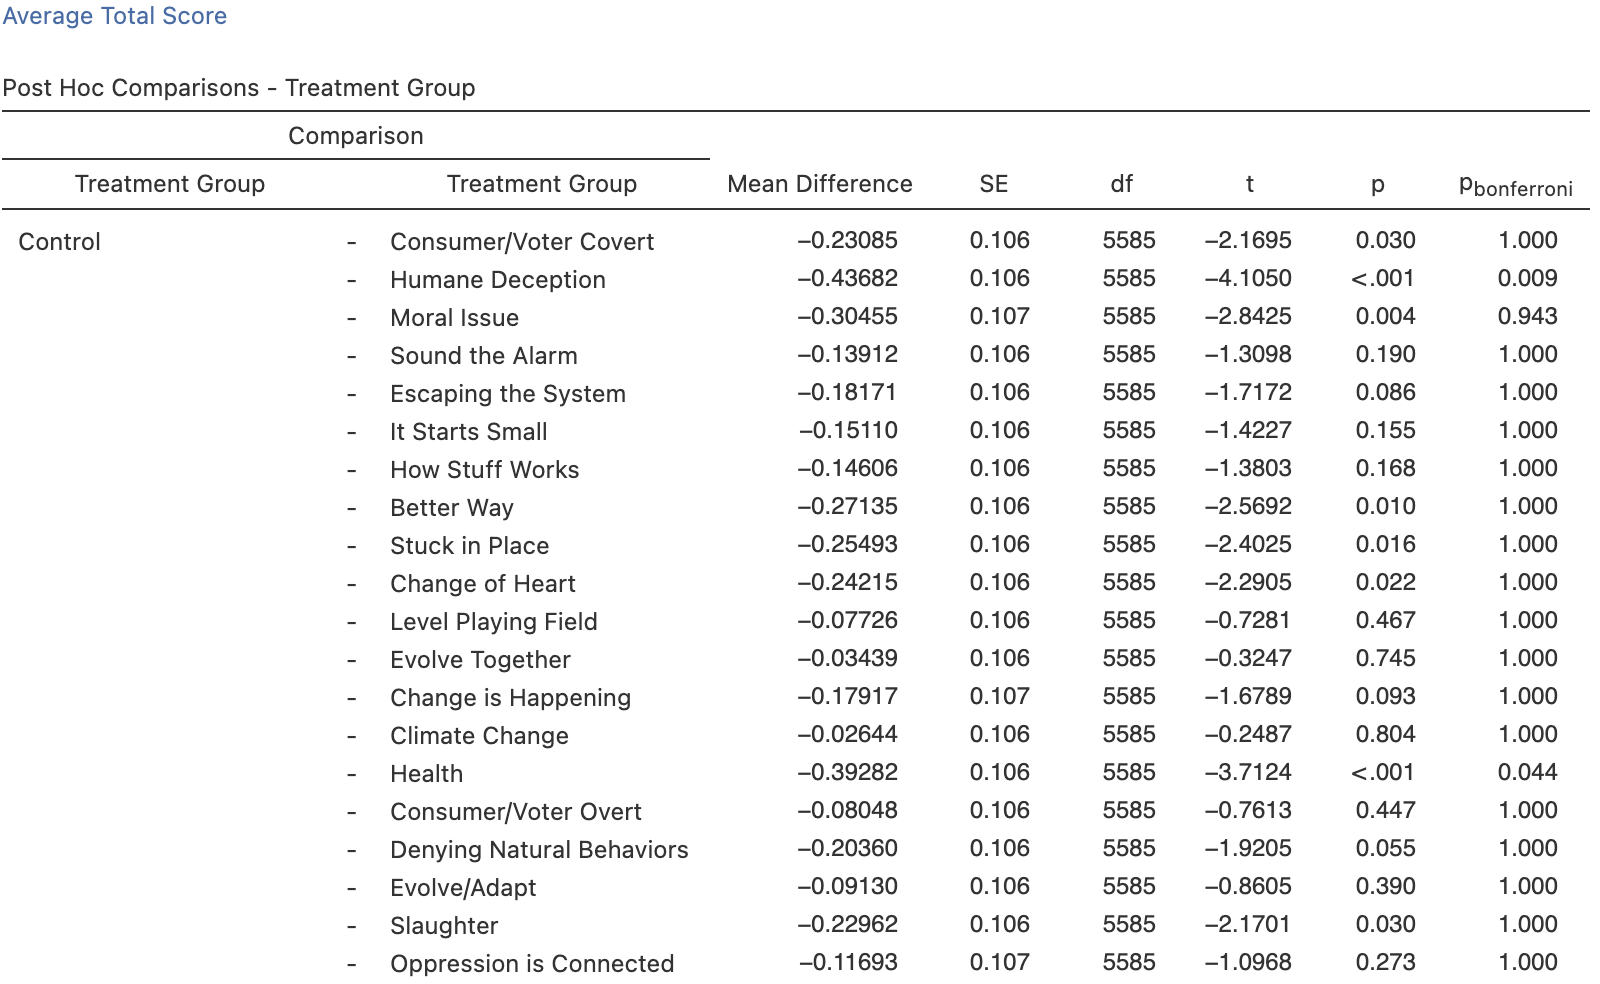
Fig. 1.1.1: All participants’ average total score P-value analysis.
Opposition
No statistical significance was detected when comparing the average total scores of the treatment groups to the control within our opposition pool of participants, even before accounting for the Bonferroni correction.
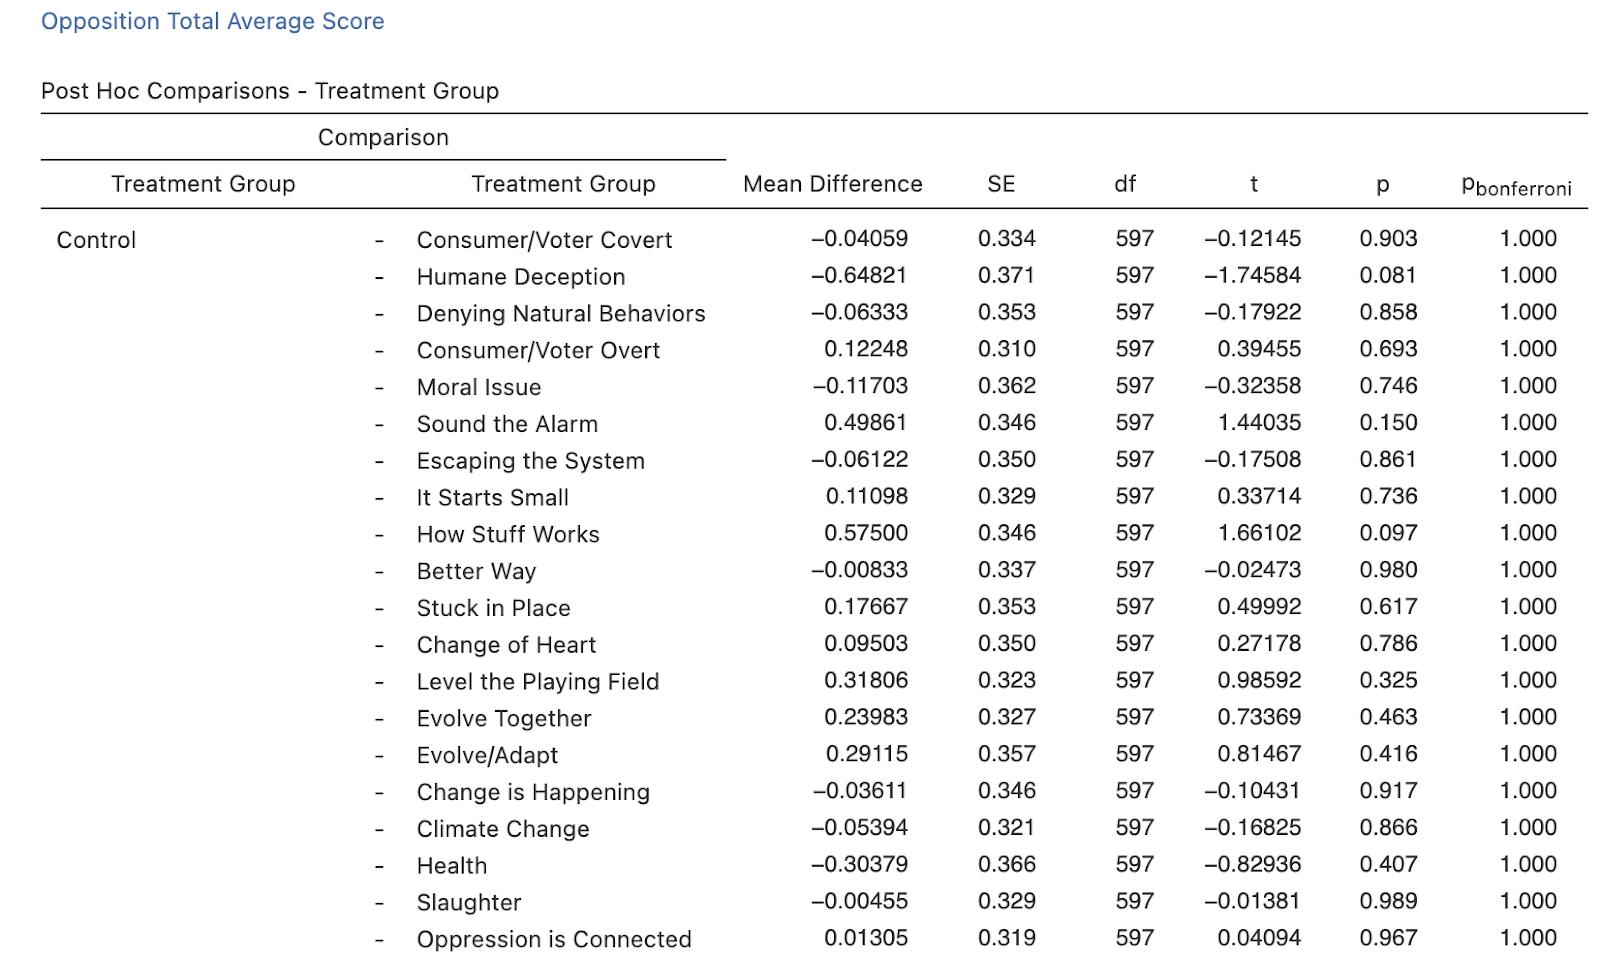
Fig. 1.1.2: Opposition participants’ average total score P-value analysis.
Persuadable
The average total score among persuadable participants was found to be significantly greater, including when accounting for the Bonferroni correction, than that of the control in the following treatment groups: Humane Deception (t(3675) = -3.93151, p < 0.001, pbonferroni = 0.018), Stuck in Place (t(3675)= -3.75067, p < 0.001, pbonferroni = 0.038) and Health (t(3765)= -3.67833, p < 0.001, pbonferroni = 0.050). Full analysis of all 23 treatment groups can be found in the table below, including the treatment groups that only had significantly greater scores before accounting for the Bonferroni correction (which include Consumer/Voter Covert, Denying Natural Behaviors, Moral Issue, Sound the Alarm, Escaping the System, It Starts Small, How Stuff Works, Better Way, Change of Heart, Climate Change, Slaughter, and Oppression is Connected).
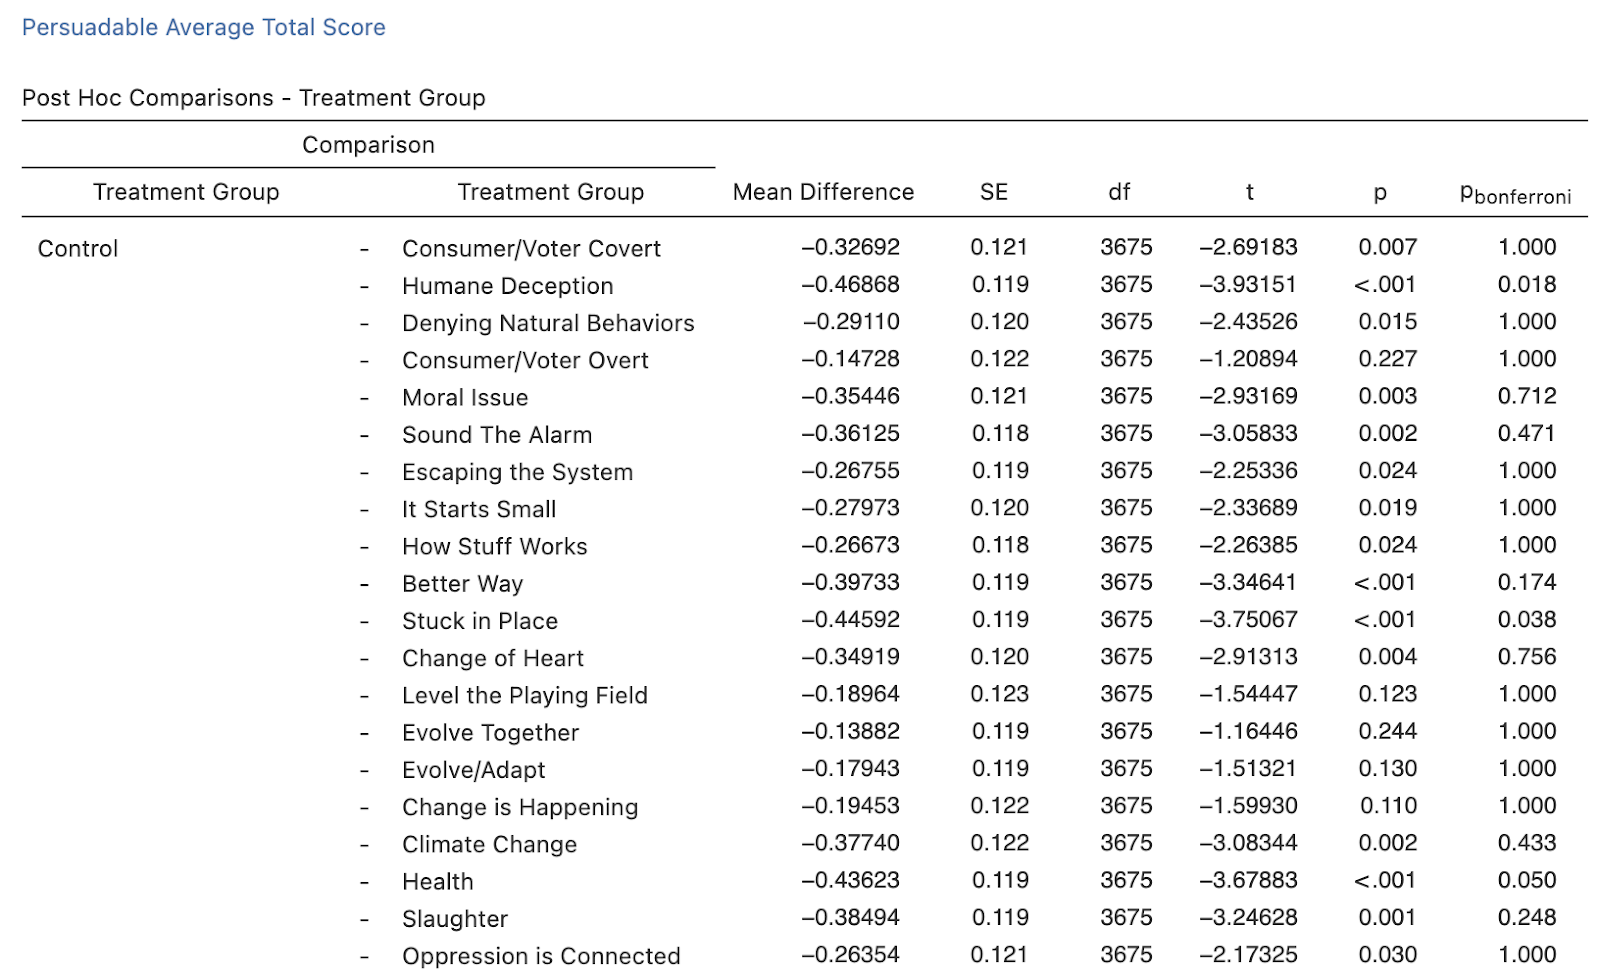
Fig. 1.1.3: Persuadable participants’ average total score P-value analysis.
Base
The average total score among our base participants was significantly greater than that of the control for both the Consumer/Voter Overt treatment (t(1271) = -2.3393, p = 0.019, pbonferroni = 1.000) and How Stuff Works treatment (t(1271) = -2.1925, p = 0.029, pbonferroni = 1.000). However, this significance was not maintained when accounting for the Bonferroni correction. No other significance was detected.
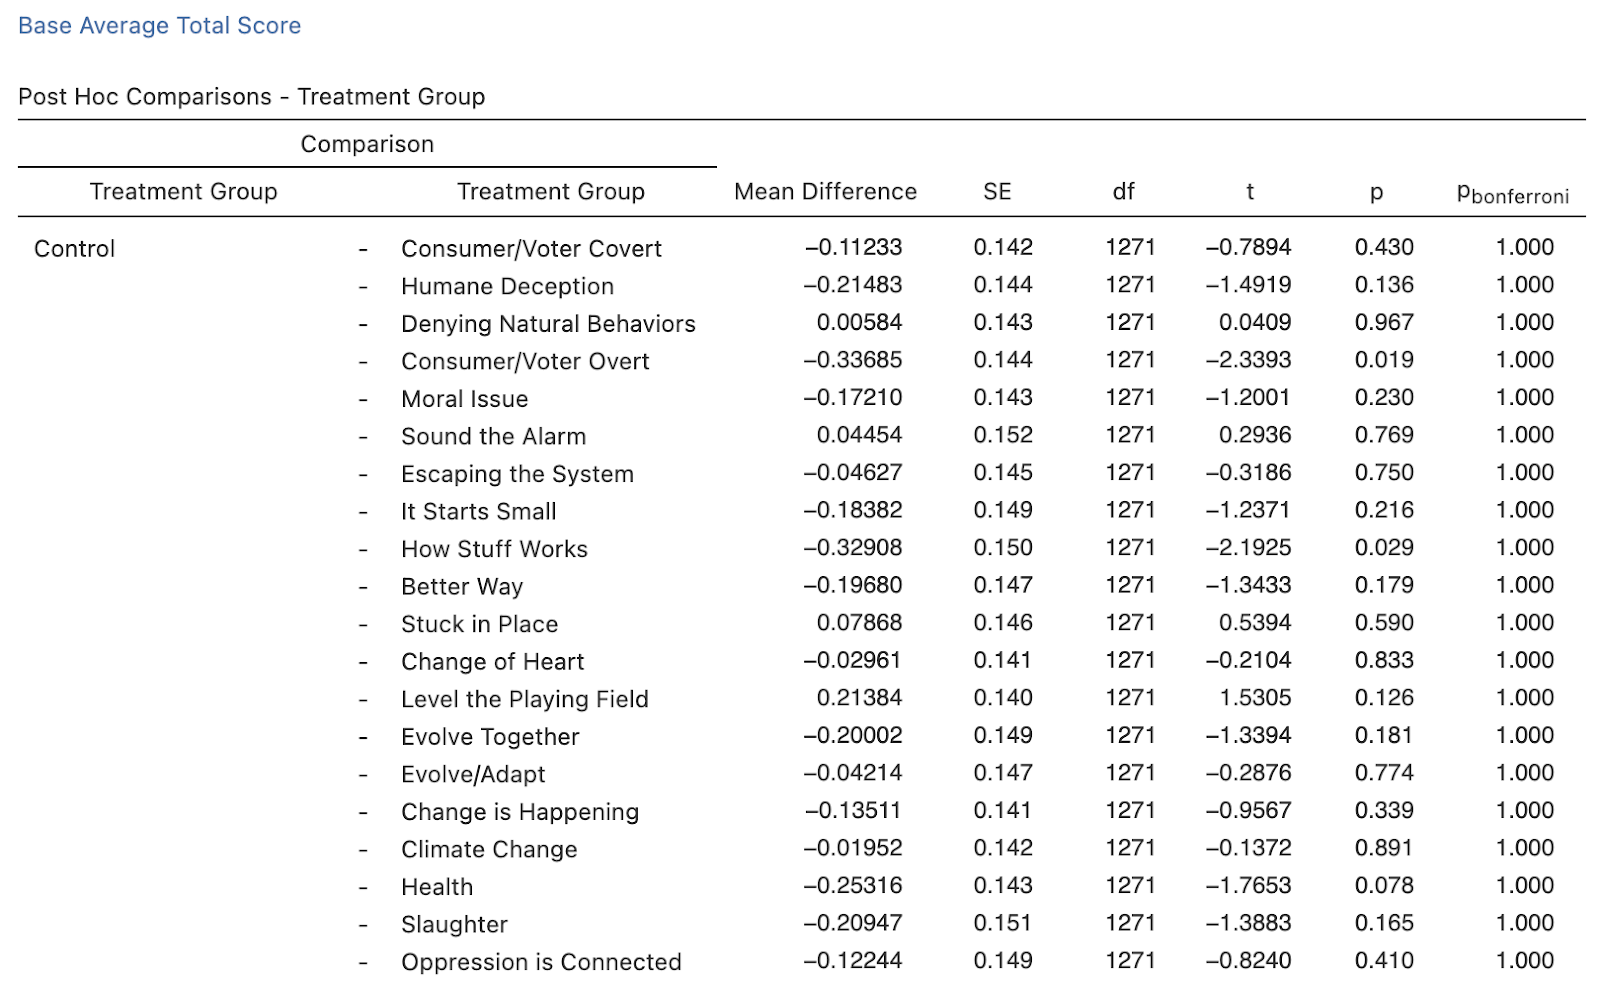
Fig. 1.1.4: Base participants’ average total score P-value analysis.
Policy Support Score
All Participants
No statistical significance was detected when comparing the policy support scores among all participants between each treatment group and the control after applying the Bonferroni correction. However, the following treatment groups had statistically significant policy support scores before applying the Bonferroni correction: Humane Deception (t(5585) = -3.00923, p = 0.003, pbonferroni = 0.552), Moral Issue (t(5585) = -2.19666, p = 0.028, pbonferroni = 1.000), Better Way (t(5585) = -1.97136, p = 0.049, pbonferroni = 1.000), Climate Change (t(5585) = -2.7029, p = 0.007, pbonferroni = 1.000), and Health (t(5585) = -3.14827, p = 0.002, pbonferroni = 0.347).
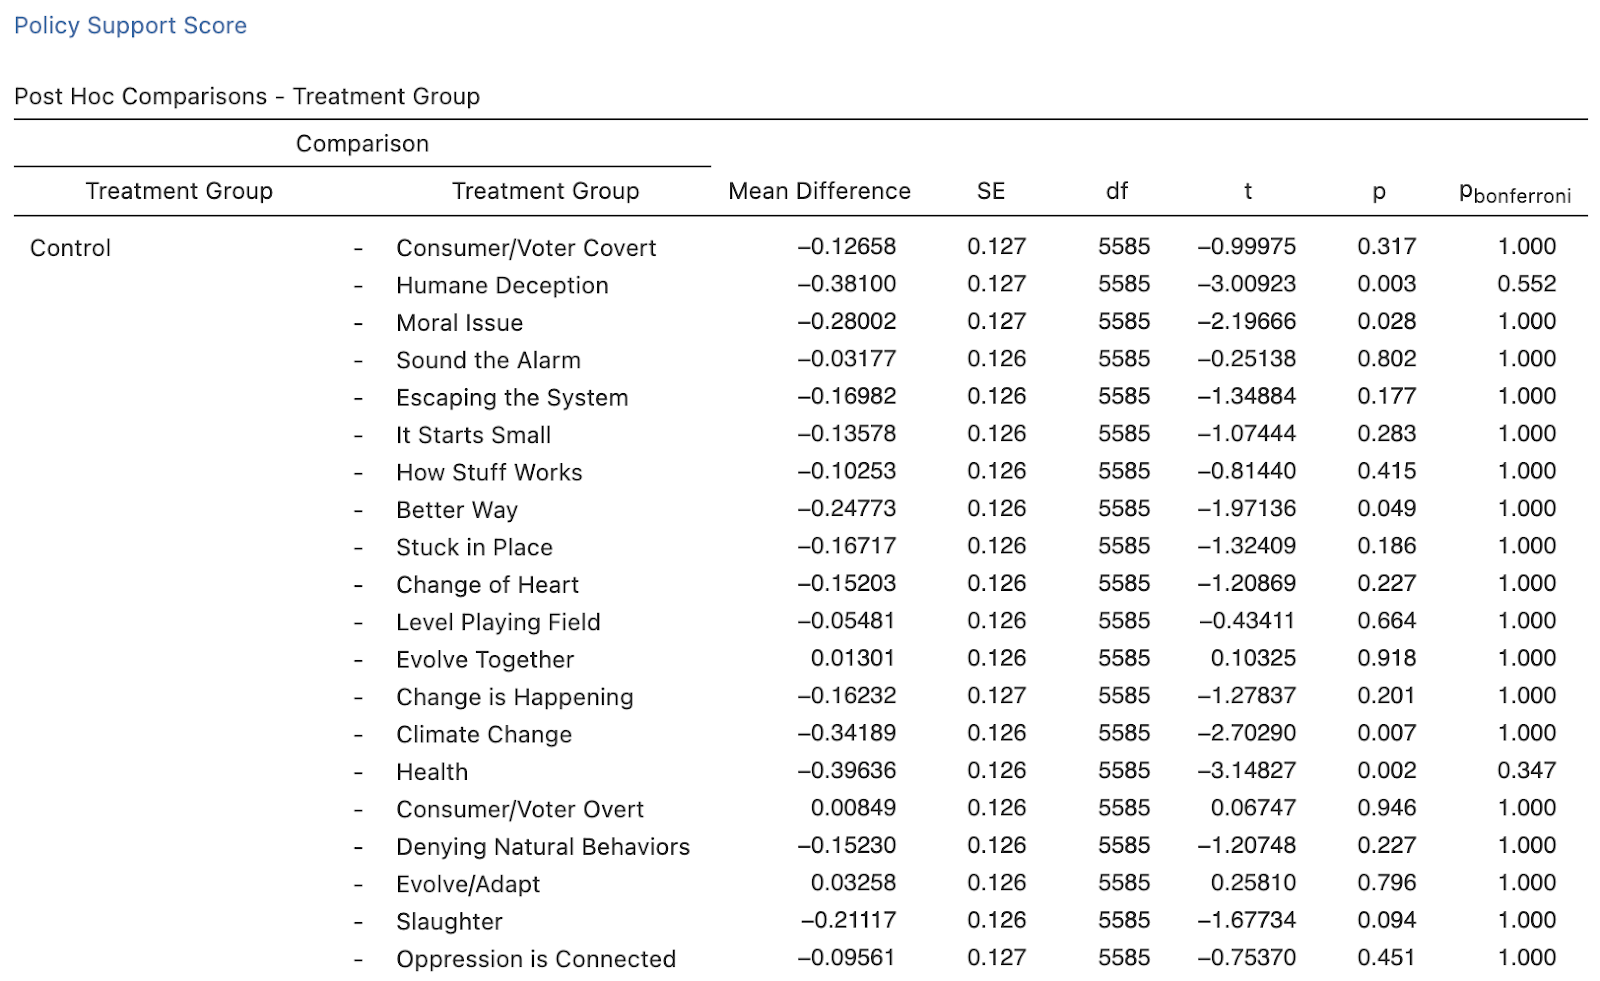
Fig. 1.2.1: All participants’ policy support score P-value analysis.
Opposition
Again, no statistical significance was detected when comparing the opposition treatment policy support scores to the control policy support score, even before accounting for the Bonferroni correction.

Fig. 1.2.2: Opposition participants’ policy support score P-value analysis.
Persuadable
No statistical significance was detected when comparing the policy support scores between each treatment group and the control after applying the Bonferroni correction among the persuadable participants. Full analysis of all 23 treatment groups can be found in the table below, including the treatment groups that only had significantly greater scores before accounting for the Bonferroni correction, which include the following: Humane Deception, Moral Issue, Sound the Alarm, Escaping the System, Better Way, Stuck in Place, Change of Heart, Climate Change, Health, and Slaughter.
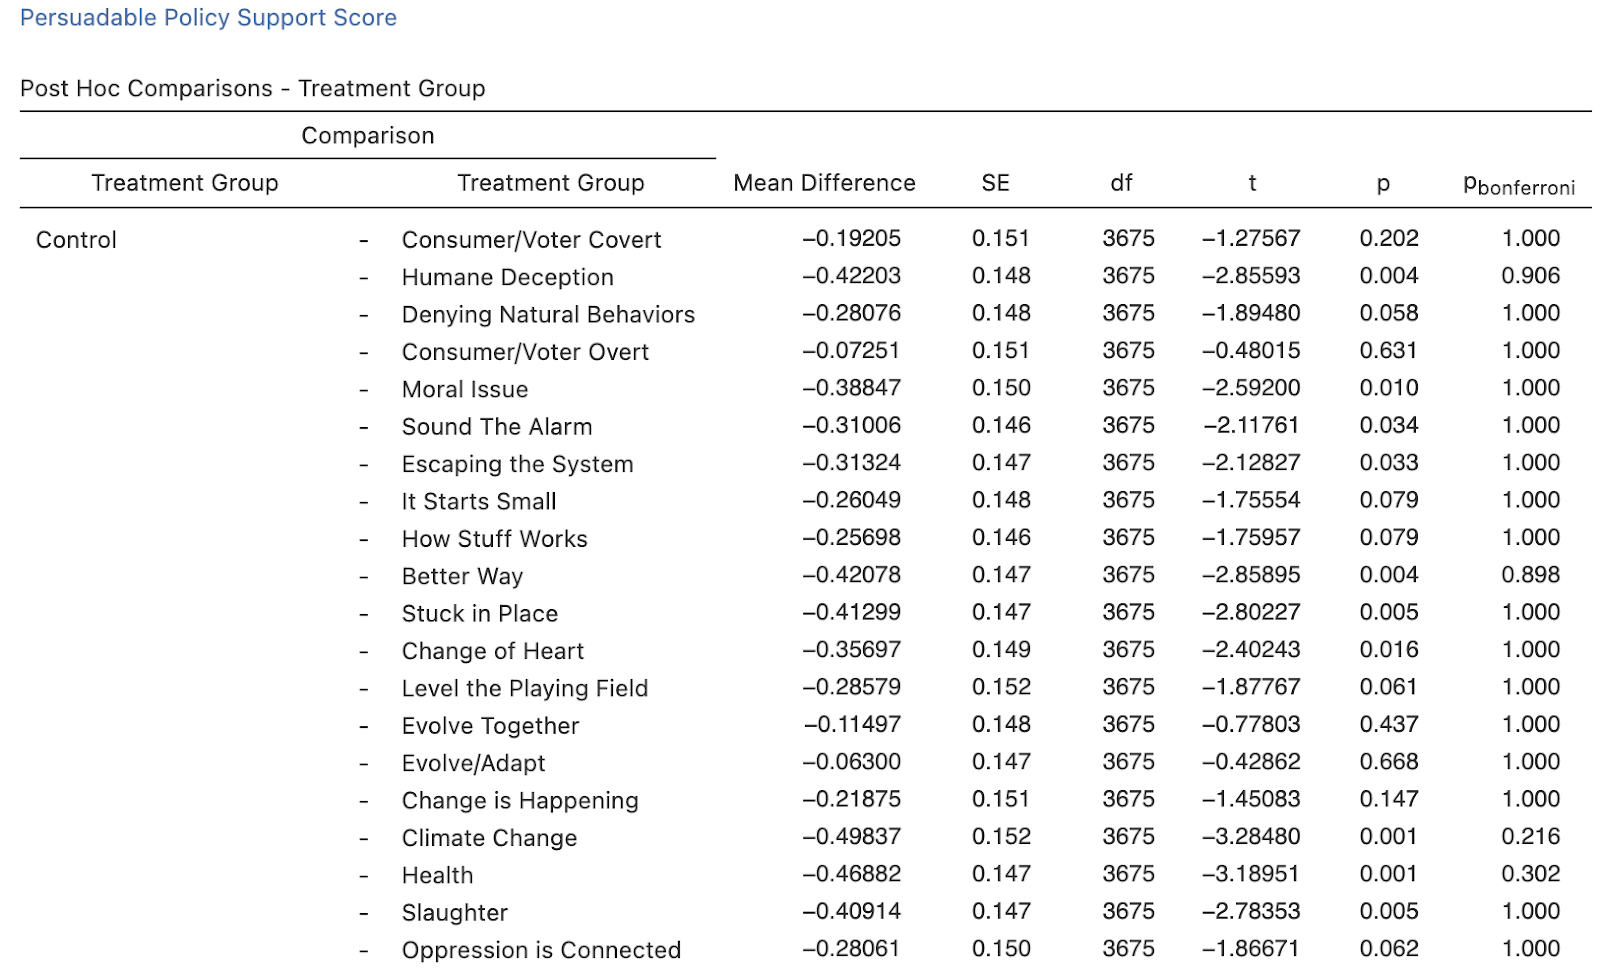
Fig. 1.2.3: Persuadable participants’ policy support score P-value analysis.
Base
The only statistical significance detected for the policy support scores among those in our base pool of participants was for the Sound the Alarm treatment, where its average score was significantly less than that of the control (t(1271) = 2.0483, p = 0.041, pbonferroni = 1.000) before accounting for the Bonferroni correction.
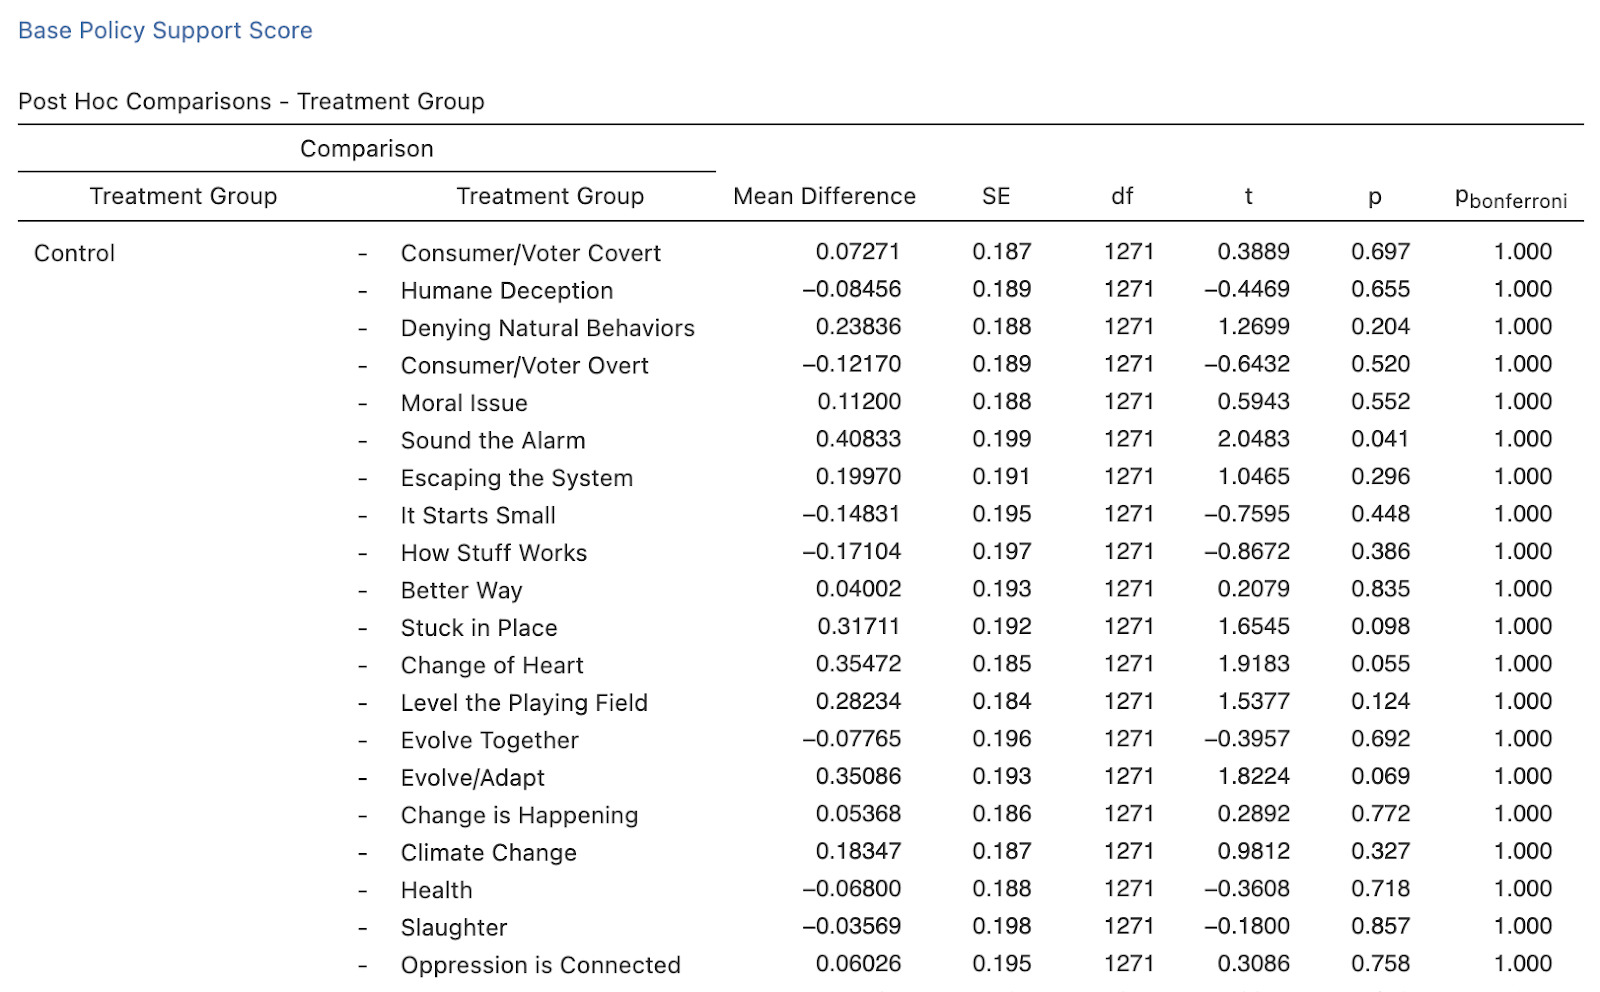
Fig. 1.2.4: Base participants’ policy support score P-value analysis.
Messenger-Likeability Score
All Participants
We found that the average messenger-likeability score among all participants was significantly greater than that of the control after applying the Bonferroni correction for just the humane deception treatment (t(5585) = -4.30857, p < 0.001, pbonferroni = 0.004). Other treatments had significantly greater scores before applying the Bonferroni correction (including Consumer/Voter Covert, Moral Issue, Better Way, Stuck in Place, Change of Heart, Climate Change, Health, Denying Natural Behaviors, and Slaughter), the full analysis of which can be seen in the table below.
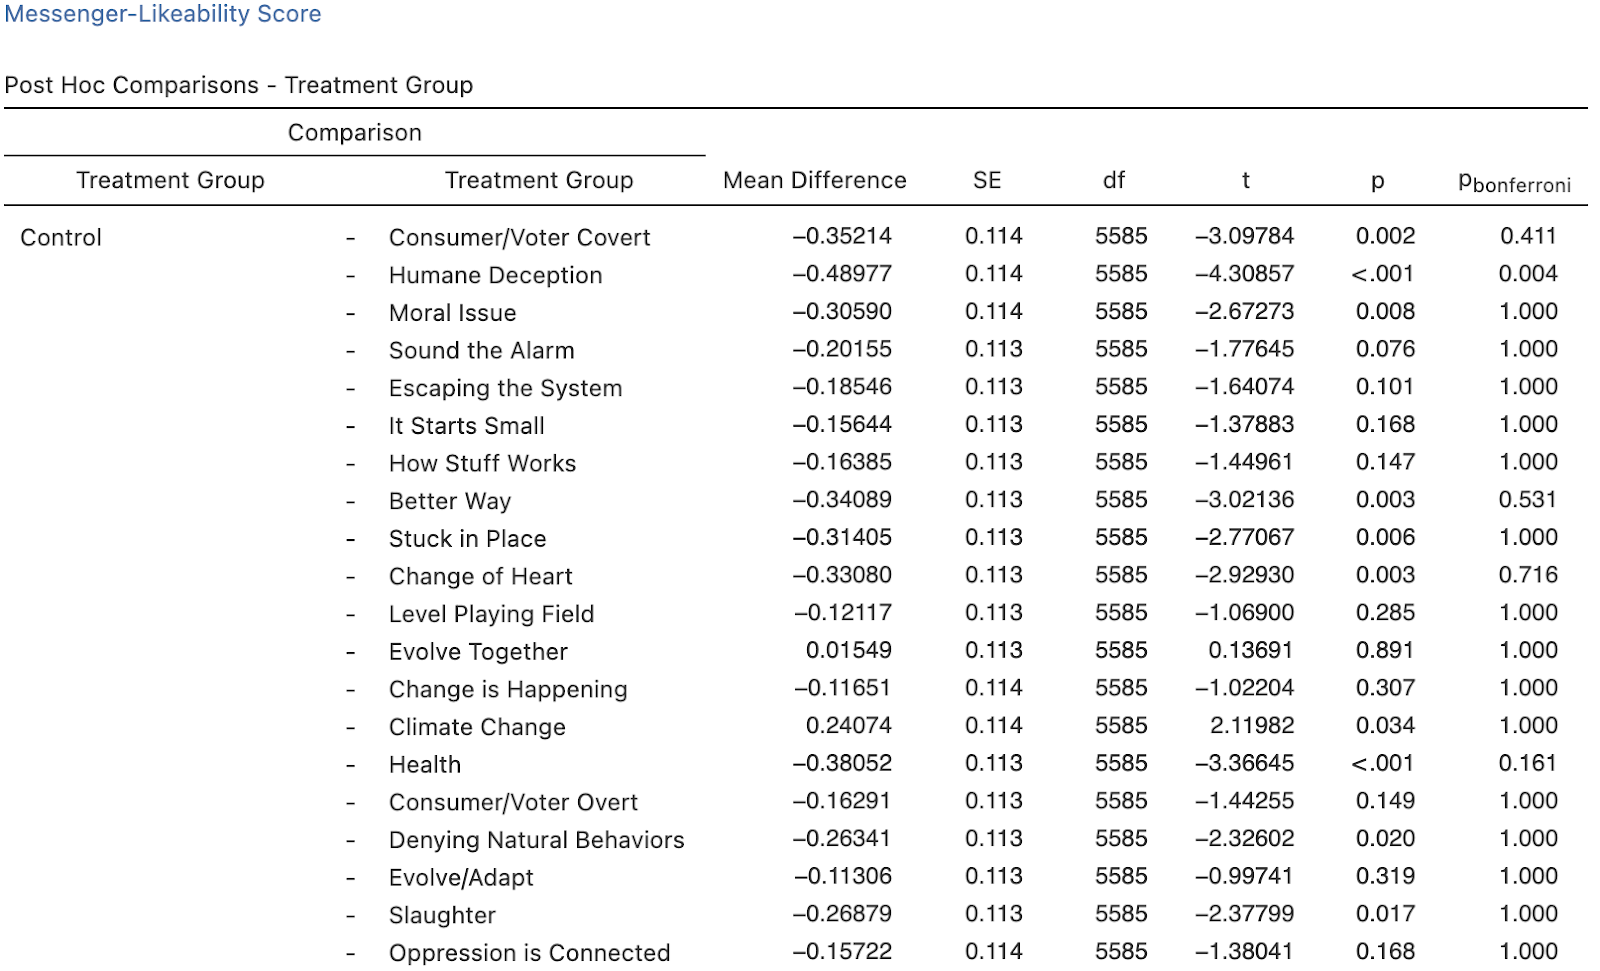
Fig. 1.3.1: All participants’ messenger-likeability score P-value analysis.
Opposition
Here, the opposition messenger-likeability scores for both the How Stuff Works treatment group (t(597)= 2.51694, p= 0.012, pbonferroni = 1.000) and Sound the Alarm treatment group (t(597)= 2.66141, p= 0.008, pbonferroni = 1.000) were significantly less than that of the control. However, the significance for both was not maintained when accounting for the Bonferroni correction.
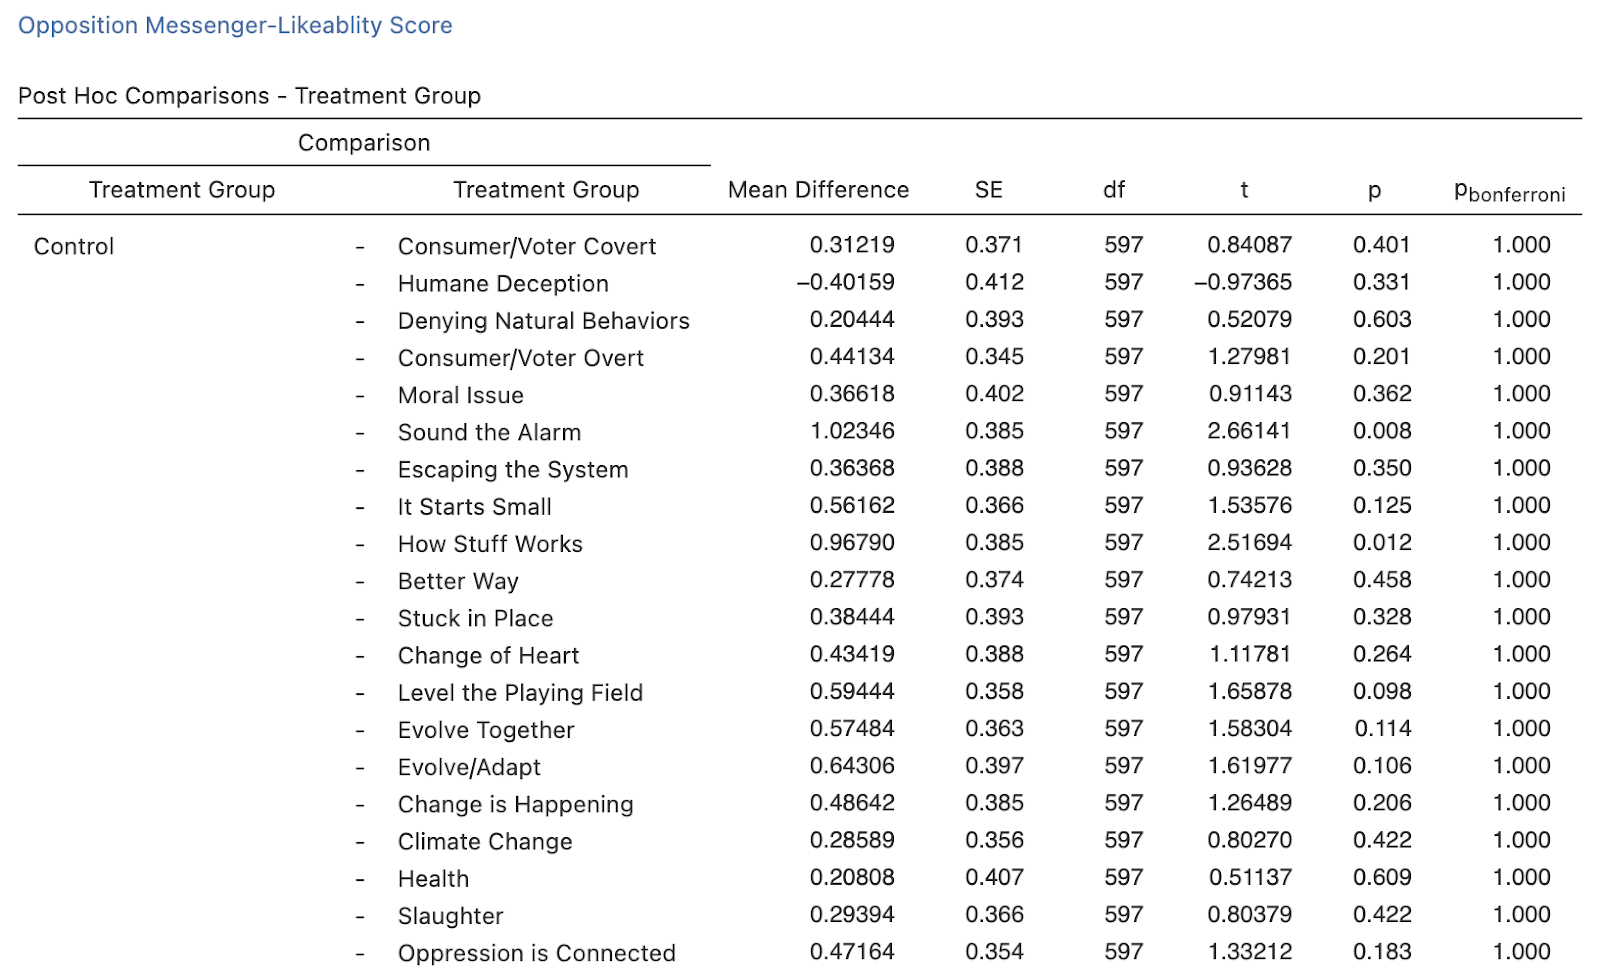
Fig. 1.3.2: Opposition participants’ messenger-likeability score P-value analysis.
Persuadable
We found that the average persuadable messenger-likeability score was significantly greater than that of the control in the following treatment groups after applying the Bonferroni correction for the Consumer/Voter Covert treatment (t(3675) = -3.7161, p < 0.001, pbonferroni = 0.043), Humane Deception treatment (t(3675) = -4.1184, p < 0.001, pbonferroni = 0.008) and the Stuck in Place treatment (t(3675) = -3.8594, p < 0.001, pbonferroni = 0.024). Other treatments had significantly greater scores before applying the Bonferroni correction (including Denying Natural Behaviors, Moral Issue, Sound the Alarm, It Starts Small, How Stuff Works, Better Way, Change of Heart, Health, Slaughter, and Oppression is Connected), the full analysis of which can be seen in the table below.
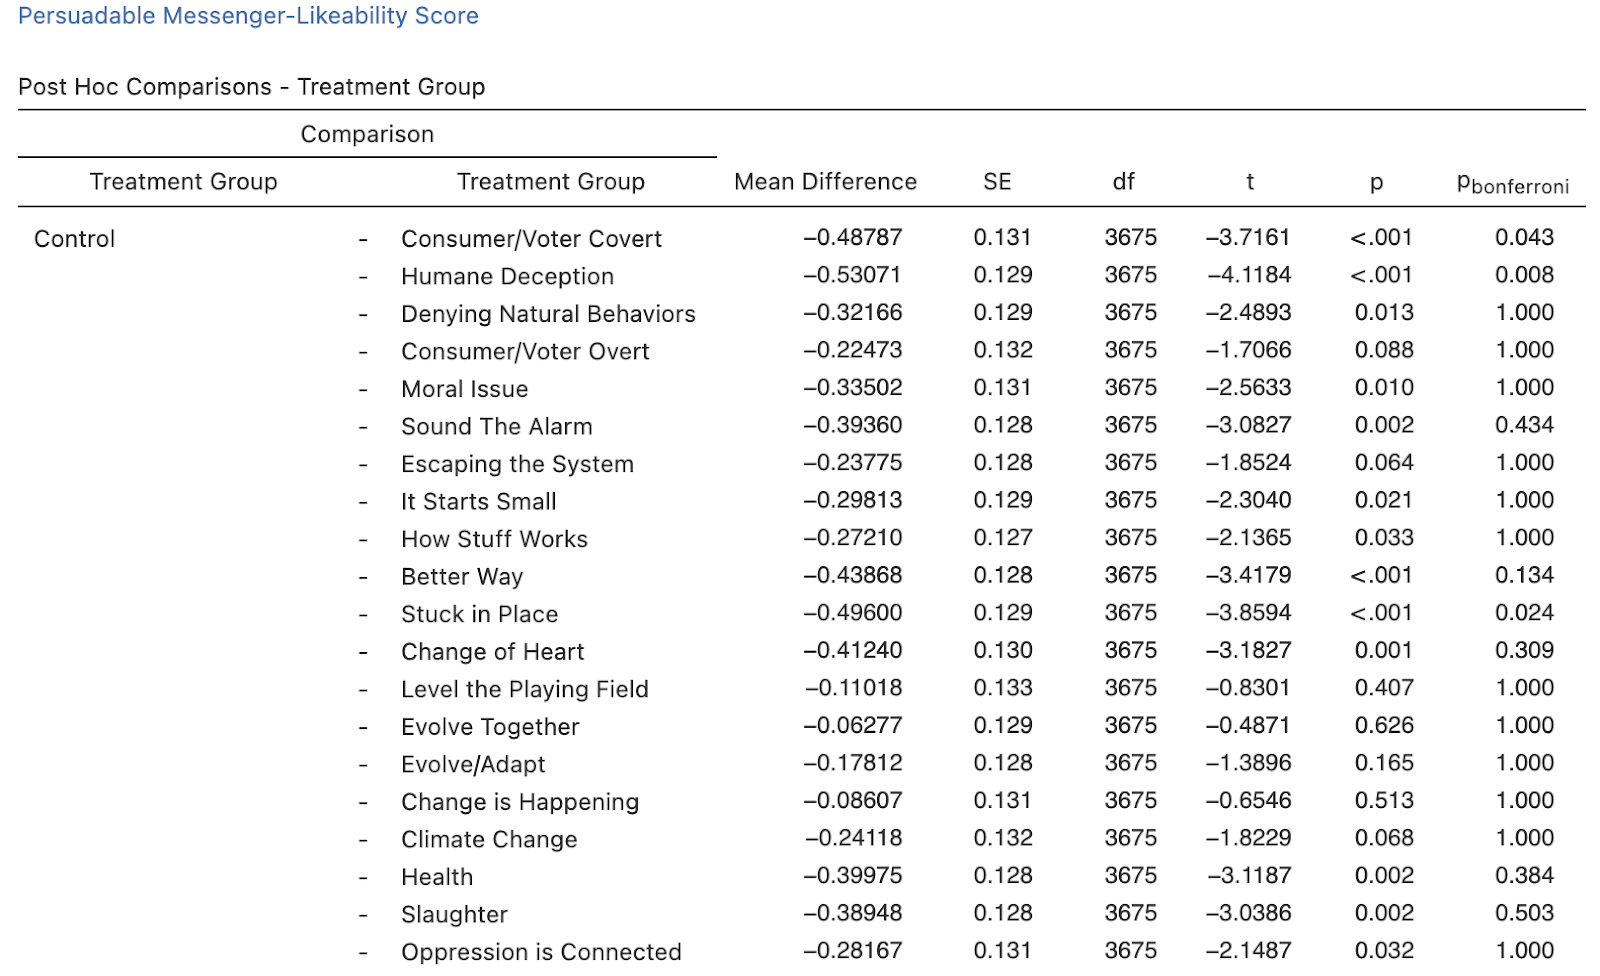
Fig. 1.3.3: Persuadable participants’ messenger-likeability score P-value analysis.
Base
We found that the average base messenger-likeability score was significantly greater than that of the control in the following treatment groups after applying the Bonferroni correction for just the Consumer/Voter Overt treatment (t(1271) = -4.0157, p < 0.001, pbonferroni = 0.013). Other treatments had significantly greater scores before applying the Bonferroni correction (including Consumer/Voter Covert, Humane Deception, Moral Issue, Sound the Alarm, Escaping the System, It Starts Small, How Stuff Works, Better Way, Change of Heart, Evolve Together, Health, Slaughter, and Oppression is Connected), the full analysis of which can be seen in the table below.
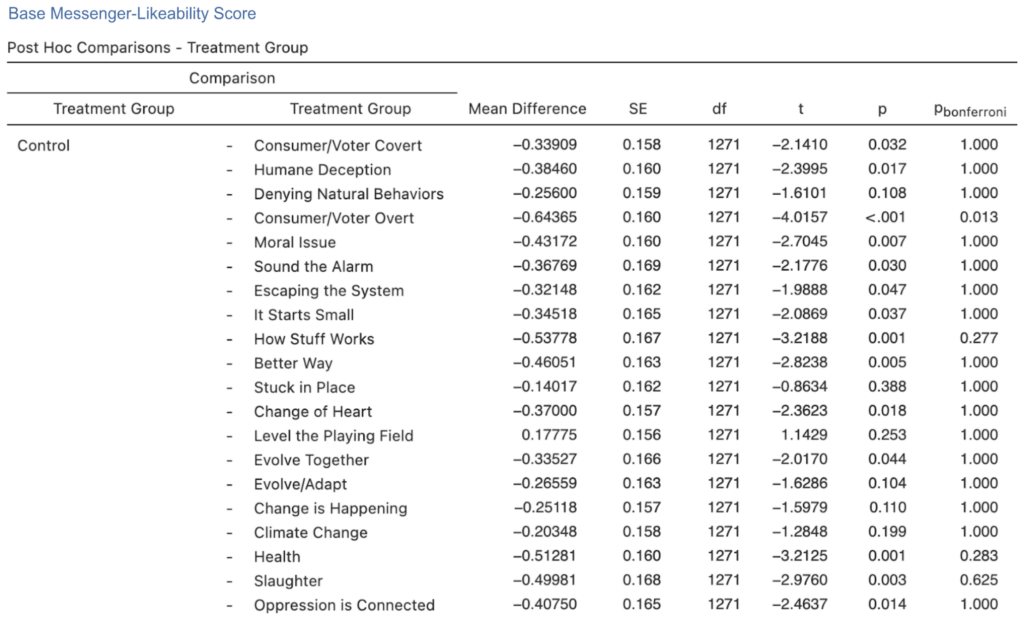
Fig. 1.3.4: Base participants’ messenger-likeability score P-value analysis.
Animal Attitude Score
All Participants
We found that the average animal attitude score among all participants was significantly greater than that of the control in the following treatment groups after applying the Bonferroni correction for both the Humane Deception treatment (t(5585) = -3.9913, p < 0.001, pbonferroni = 0.014) and Health treatment (t(5585) = -3.7164, p < 0.001, pbonferroni = 0.042). Treatments that showed statistical significance before applying the Bonferroni correction, however, include Moral Issue, Stuck in Place, Change of Heart, Change is Happening, and Evolve/Adapt, the full analysis of which can be seen in the figure below.
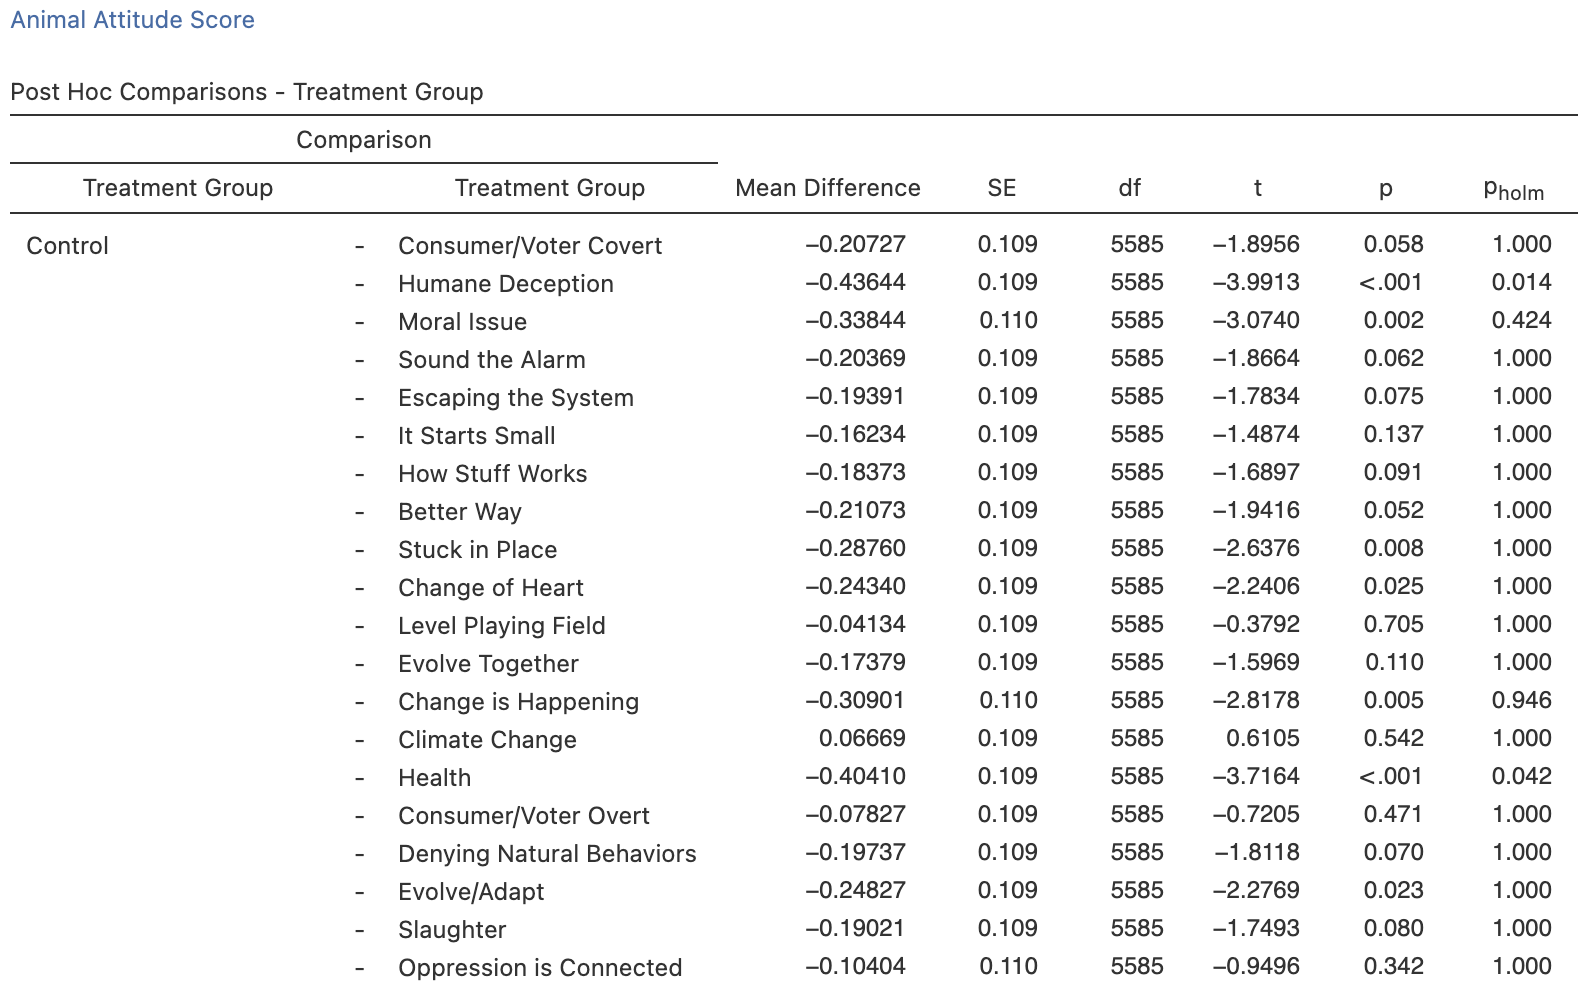
Fig. 1.4.1: All participants’ animal attitude score P-value analysis.
Opposition
Here, only the Humane Deception treatment was found to have a significantly greater animal attitude score than the control group (p(597)= -2.33723, p = 0.02, pbonferroni = 1.000) among those in our opposition group. Again, however, this significance was not maintained when accounting for the Bonferroni correction.
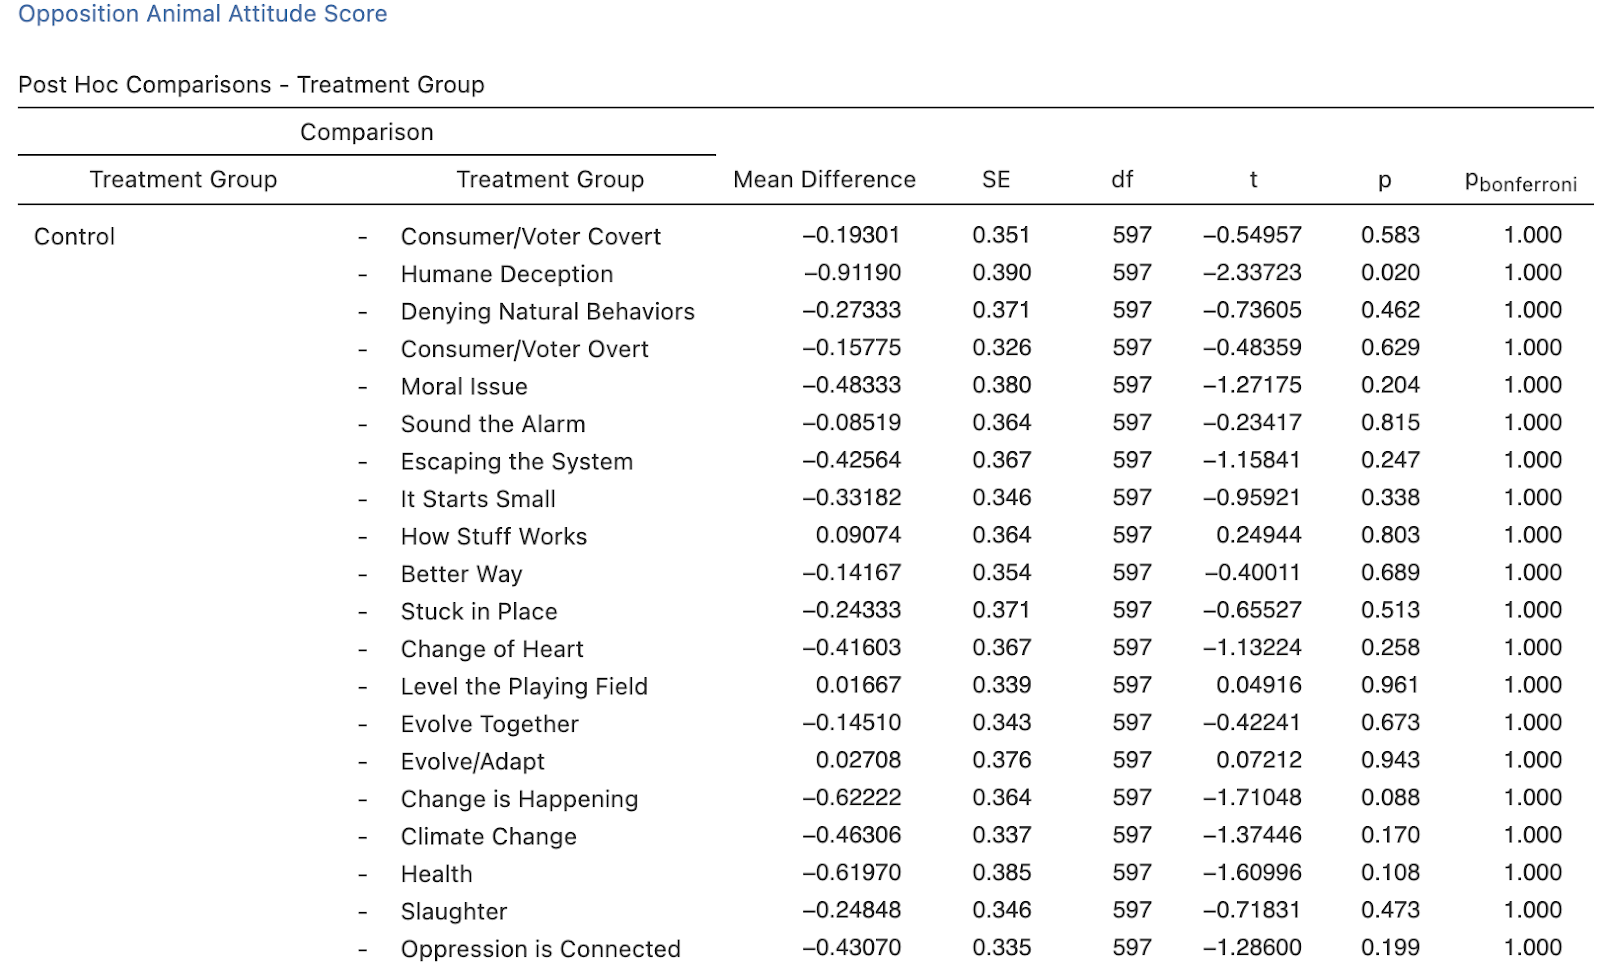
Fig. 1.4.2: Opposition participants’ animal attitude score P-value analysis.
Persuadable
No statistical significance was detected when comparing the animal attitude scores between each treatment group and the control after applying the Bonferroni correction among the persuadable participants. Full analysis of all 23 treatment groups can be found in the table below, including the treatment groups that only had significantly greater scores before accounting for the Bonferroni correction at p < 0.05, which include the following: Consumer/Voter Covert, Humane Deception, Denying Natural Behaviors, Moral Issue, Sound the Alarm, Escaping the System, It Starts Small, How Stuff Works, Better Way, Stuck in Place, Change of Heart, Evolve Together, Evolve/Adapt, Change is Happening, Climate Change, Health, and Slaughter.
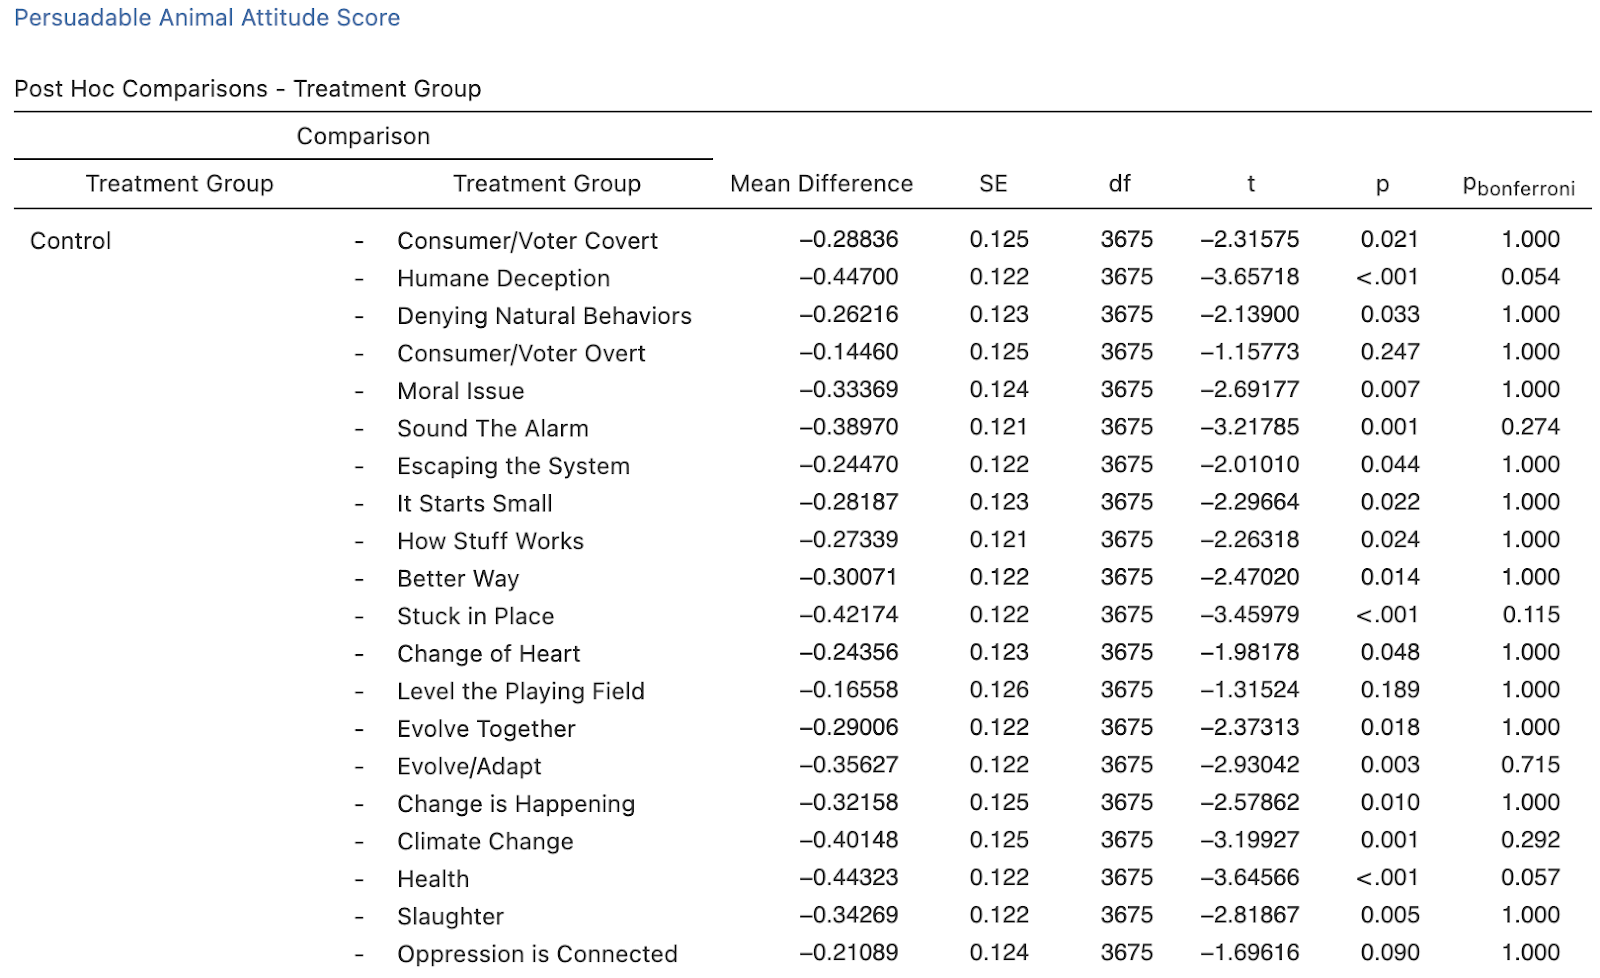
Fig. 1.4.3: Persuadable participants’ animal attitude score P-value analysis.
Base
No statistical significance was detected when comparing the animal attitude score for each treatment to that of the control among our base participants, even before applying the Bonferroni correction.
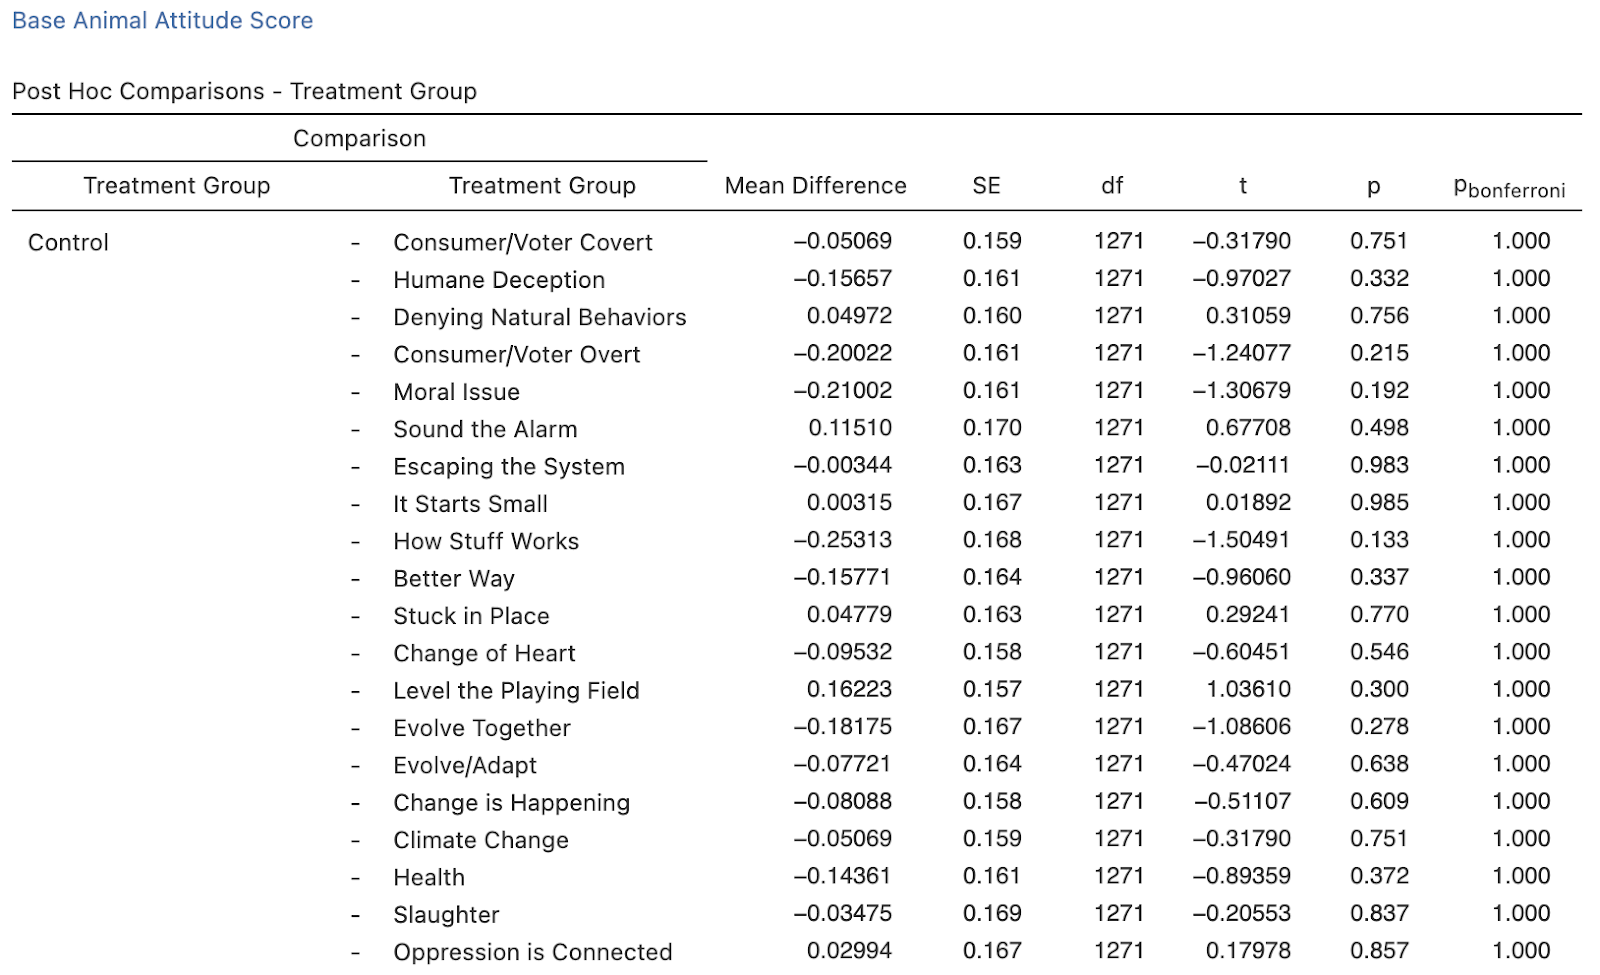
Fig. 1.4.4: Base participants’ animal attitude score P-value analysis.
Discussion
Our results show that, across all participants, the humane deception-themed op-ed created the most positive change regarding participants’ support for a plant-based procurement policy and their general attitudes towards animals. The op-ed that detailed the health benefits of a plant-based diet closely followed. Other op-ed themes that often brought about statistically significant scores before the addition of the Bonferroni correction include consumer/voter (covert), better way, moral issue, and change of heart.
For the persuadable segment of participants– the largest and arguably most important segmentation of our participants– the humane deception, stuck in place, and health-themed op-eds were generally the most effective in garnering support for this policy and of farmed animals more broadly.
Our results also generally show that explicitly meat-eating messengers, or those who had been involved in animal agribusiness, were more “likable” and “relatable” to our participants. Among those in our opposition group, more progressive messengers such as climate change scientists were less likable and relatable, which makes sense given the group’s conservatism.
While scores were overall higher for our base participants, indicating a higher level of support for the animal freedom movement, few statistically significant differences were detected between treatments. It may be that new information to people already familiar with and somewhat supportive of the animal movement has less of an impact on their beliefs, although the little difference found may also be due to the small sample size of our base participant pool.
A similar phenomenon was seen within our opposition participant group. Their scores were generally low, and little difference was detected between treatment scores. In this case, it could also be that new information has little effect on those who are already so distrusting and unsupportive of the animal movement, or again, it could be that the sample size of our opposition participant population was too small to detect any meaningful differences between treatment groups.
In some contexts, advocates may consider the persuadable segment to be the main target audience. For instance, while campaigns to promote diet change will find the earliest adopters among the base group, ballot measure campaigns are likely to be decided by persuadable voters. Some additional messages showed efficacy among the persuadable group, particularly the Stuck in Place message.
Study 2: Framework Survey Experiment
Materials and Methods
For our second study, we sought to narrow down our research question to discover the difference, if any, between the more common consumer frame and our proposed civic/evolve together frame in increasing participants’ support for the animal movement. We additionally sought to test if the tone or subject of a message had any such effects. Finally, we included the main three veins of meat-reduction messaging– animal suffering, health, and climate change (focusing on humane deception for the animal suffering message because of its strong performance in the previous experiment)– to further compare these three common approaches.
Participants
Initially, 3463 U.S.-based participants over the age of 18 were recruited to participate in a 3-minute long “policy framework study” with an incentive of 60 cents. After disqualifying participants for failing attention checks, not providing consent, or otherwise returning their submissions, we were left with a study population of 3344 participants.
The age of the average participant in our final participant pool was 34.15, while 47.76% identified as female, 49.37% identified as male, and 2.87% responded “other/prefer not to disclose.”
Procedure
Using a 3x2x2 factorial design, participants were randomly assigned to the control op-ed or one of 12 treatment op-eds, all of which were either: themed around climate change, health, or the deception of “humane” meat; used “dry” or “emotional” language; and were framed using the “consumer” or “evolve together/citizen” framework. A figure of the 3x2x2 design of the treatment op-eds can be seen below.
All participants then answered a series of questions that measured their level of support for a ballot measure designed to “protect animals and promote plant-based diets by subsidizing the cost of animal-free food alternatives” and their attitudes towards farmed animal issues.
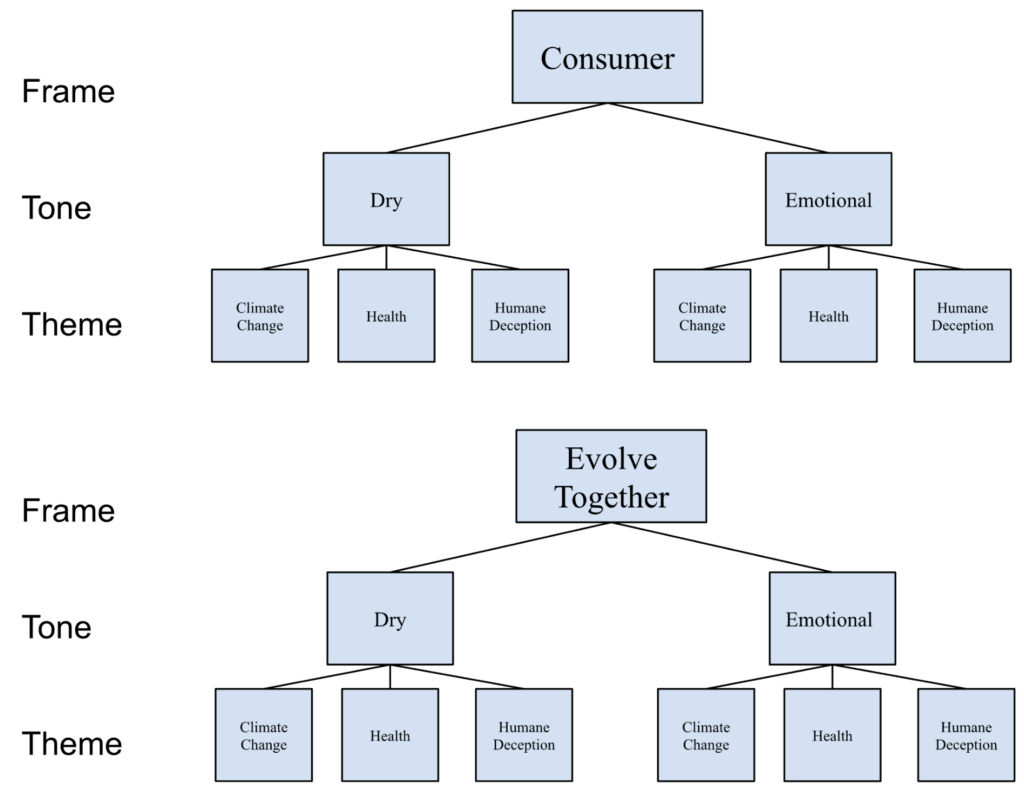
Fig. 2: 3x2x2 factorial design for this study.
Dependent Variables
We measured three dependent variables for all participant groups. These included their policy support score, animal attitude score, and the average of both scores. Scores were measured using a 7-point Likert scale.
Analysis
Similar to our previous study, we used Jamovi (an open-source, free data analysis tool similar to SPSS) to perform a factorial ANOVA analysis of our data, which additionally included post-hoc comparisons. We first analyzed the results of all participants in each treatment group, and then further broke each treatment and control group into three smaller groups, based on previously scored demographic questions answered by all participants which aimed to estimate how likely they would be to support our cause (see appendix for additional information). We titled these groups opposition (n =377), persuadable (n = 2069) and base (n = 890).
Results
Average Total Score
All Participants
Only the theme variable produced statistically significant differences between average total scores among all participants (at p = 0.015). Here, the humane deception theme performed significantly better than the health theme (t(3332)= 2.845, p = 0.004, pbonferroni= 0.013), but its slightly higher score was not statistically significant from the climate change theme’s score. While the consumer frame and emotional tone performed just slightly better than their variable counterparts, no other statistical significance was detected.
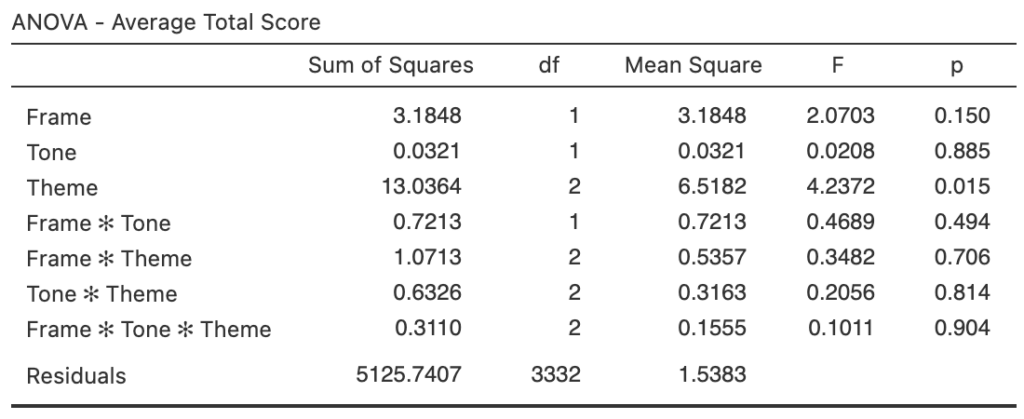
Fig. 2.1.1a: All participants’ average total score P-value analysis across all variable combinations.
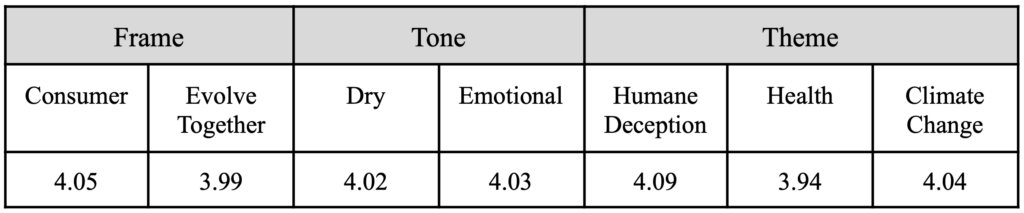
Fig. 2.1.1b: All participants’ average total scores across all variables.
Opposition
For the opposition group’s average total score, only the frame variable proved to be statistically significant (at p= 0.006). In this case, the consumer frame performed significantly better than the evolve together frame (t(365)= 2.74, p= 0.006, pbonferroni= 0.006). While the humane deception theme and emotional tone performed better than their variable counterparts, no other statistical significance was detected.
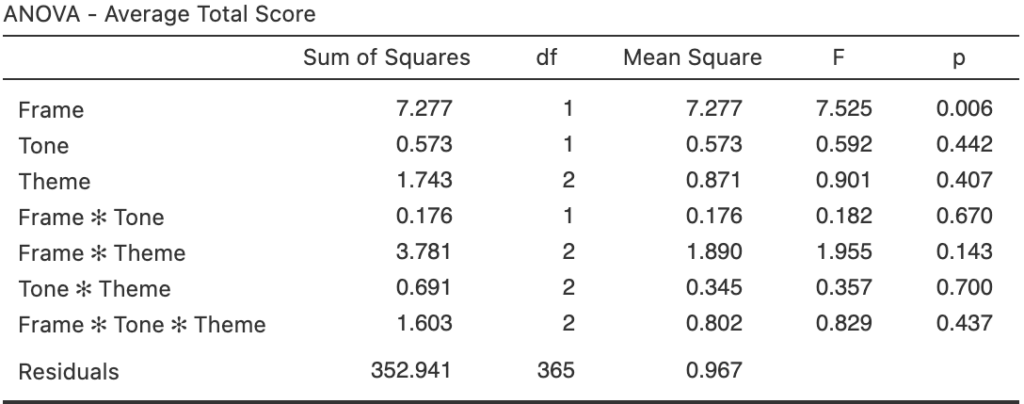
Fig. 2.1.2a: Opposition participants’ average total score P-value analysis across all variable combinations.
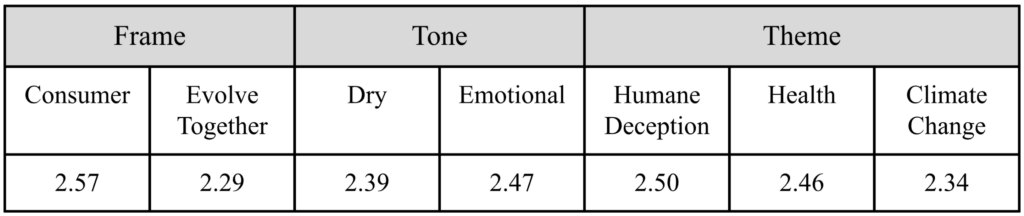
Fig. 2.1.2b: Opposition participants’ average total scores across all variables.
Persuadable
In regard to the persuadable group’s average total scores, only the theme variable showed statistical significance (at p = 0.002). In this case, the humane deception theme scores were significantly greater than that of the health treatment (t(2057)= 3.45, p < 0.001, pbonferroni= 0.002) and the climate change treatment, before the Bonferroni correction was applied (t(2057)= 2.39, p = 0.017, pbonferroni= 0.051). While the consumer frame outperformed the evolve together frame marginally, and both tone treatments produced equal scores, no other statistical significance was detected.
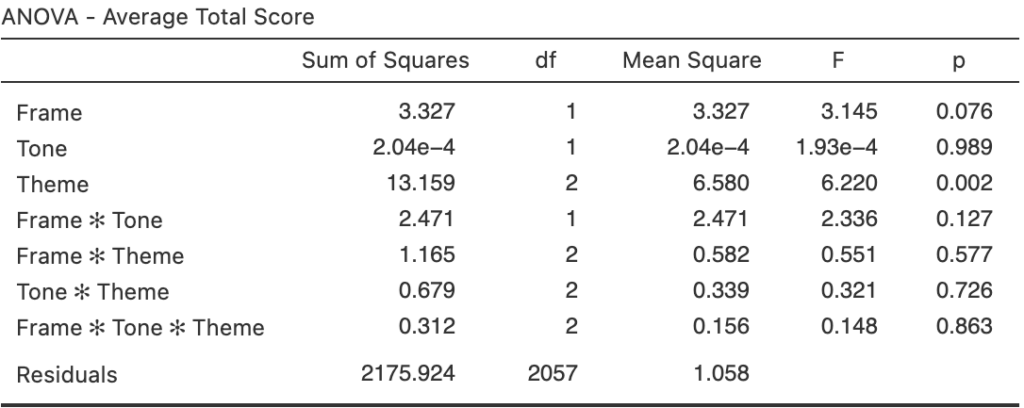
Fig. 2.1.3a: Persuadable participants’ average total score P-value analysis across all variable combinations.
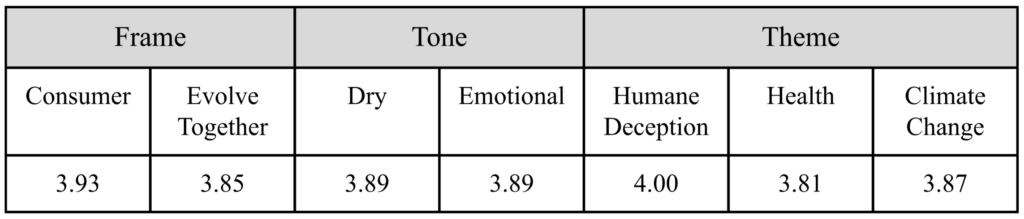
Fig. 2.1.3b: Persuadable participants’ average total scores across all variables.
Base
Only the theme variable showed statistical significance when compared to both the frame and tone variables (at p = 0.011). In this case, however, the climate change theme performed the best and produced significantly larger scores than the health treatment (p(877) = -2.943, p = .003, pbonferroni= 0.01) and marginally greater scores than that of the humane deception treatment (p(877) = -1.984, p = 0.048, pbonferroni= 0.143). While the dry tone and consumer frame performed marginally better than their variable counterparts, no other statistical significance was detected.
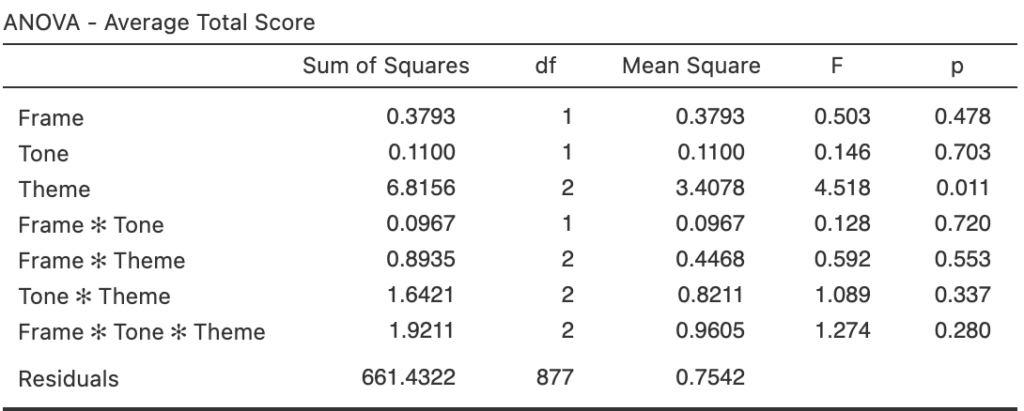
Fig. 2.1.4a: Base participants’ average total score P-value analysis across all variable combinations.

Fig. 2.1.4b: Base participants’ average total scores across all variables.
Policy Support Score
All Participants
When analyzing all participants’ average policy support score, tone was the only single variable to show statistical significance at p = 0.006. However, all variable interactions showed additional statistical significance at p < 0.05 [frame * tone (p = 0.029), frame * theme (p = 0.035), tone * theme (p = 0.003), frame * tone * theme (p < 0.001)]. In this case, the emotional tone performed significantly better than the “dry” tone (t(3332) = 2.74, p = 0.006, pbonferroni= 0.006). While both the evolve together frame and health theme performed slightly better than their variable counterparts, no other statistical significance was detected.
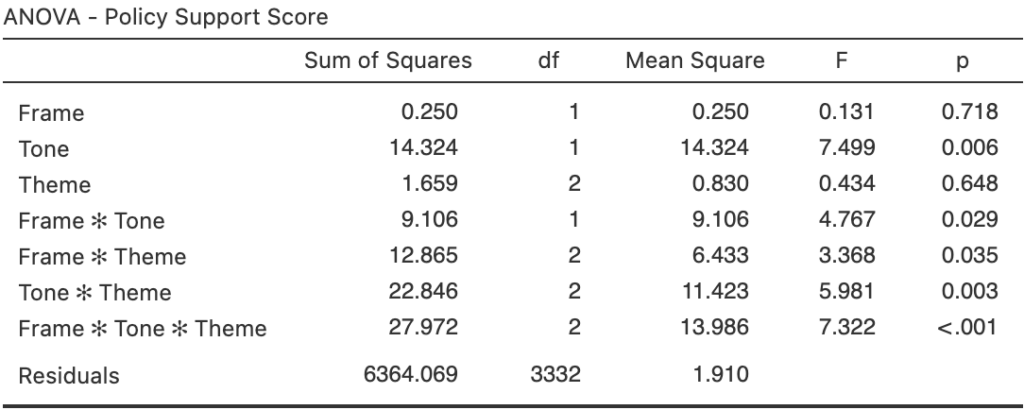
Fig. 2.2.1a: All participants’ average policy support score P-value analysis across all variable combinations.
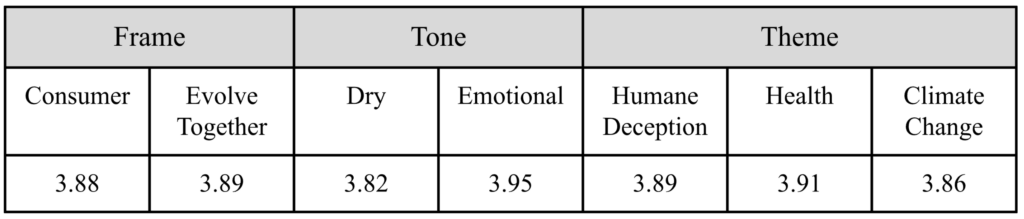
Fig. 2.2.1b: All participants’ average policy support scores across all variables.
Opposition
For the opposition’s policy support score, only the frame variable showed statistical significance (at p = 0.029). In this case, the consumer frame performed better than the evolve together frame (t(365) = 2.19, p = 0.029, pbonferroni= 0.029). Additionally, both the emotional tone and humane deception theme performed marginally better than their variable counterparts. However, no other statistical significance was detected.
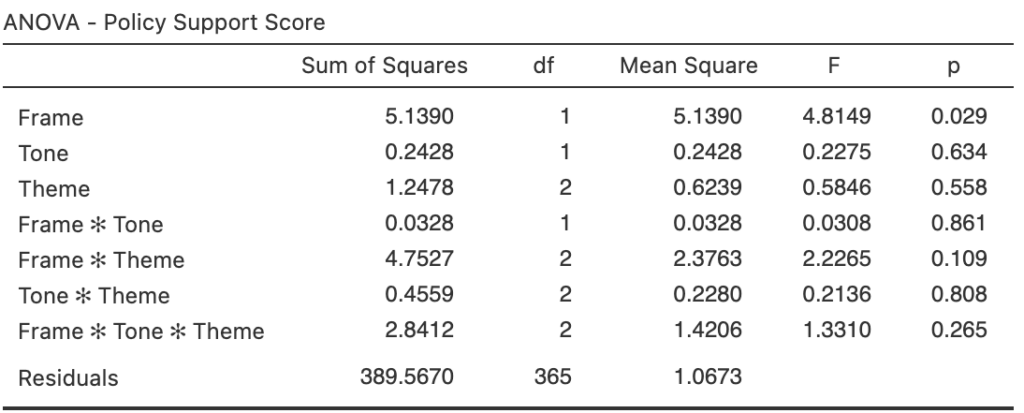
Fig. 2.2.2a: Opposition participants’ average policy support score P-value analysis across all variable combinations.
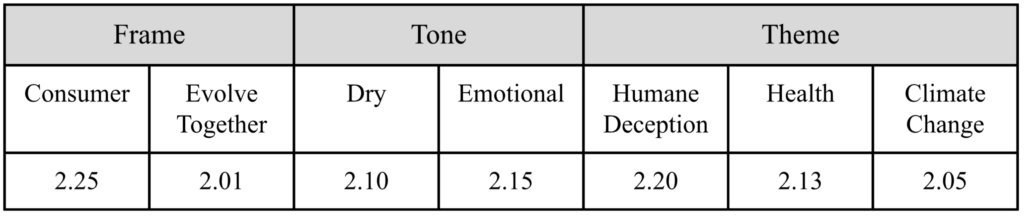
Fig. 2.2.2b: Opposition participants’ average policy support scores across all variables.
Persuadable
Both the frame and theme variables proved significant when analyzing the persuadable policy support scores (frame at p = 0.002, theme at p = 0.011). In this case, the consumer frame outperformed the evolve together frame (t(2057)= 3.09, p = 0.002, pbonferroni= 0.002), and the humane deception theme performed significantly better than the health theme (t(2057)= 2.98, p = 0.003, pbonferroni= 0.009).
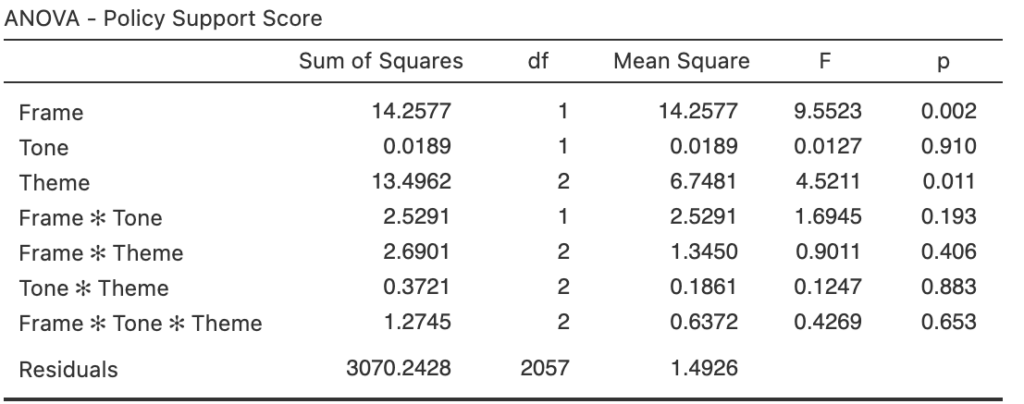
Fig. 2.2.3a: Persuadable participants’ average policy support score P-value analysis across all variable combinations.

Fig. 2.2.3b: Persuadable participants’ average policy support scores across all variables.
Base
For base participants, only the theme variable significantly affected policy support scores at p = 0.002. In this case, however, the climate change theme performed significantly better than both the humane deception (t(877) = -2.806, p = 0.005, pbonferroni= 0.015) and health (t(877) = -3.328, p < 0.001, pbonferroni= 0.003) themes. While the emotional tone and evolve together frame performed slightly better than their variable counterparts, no other statistical significance was detected.
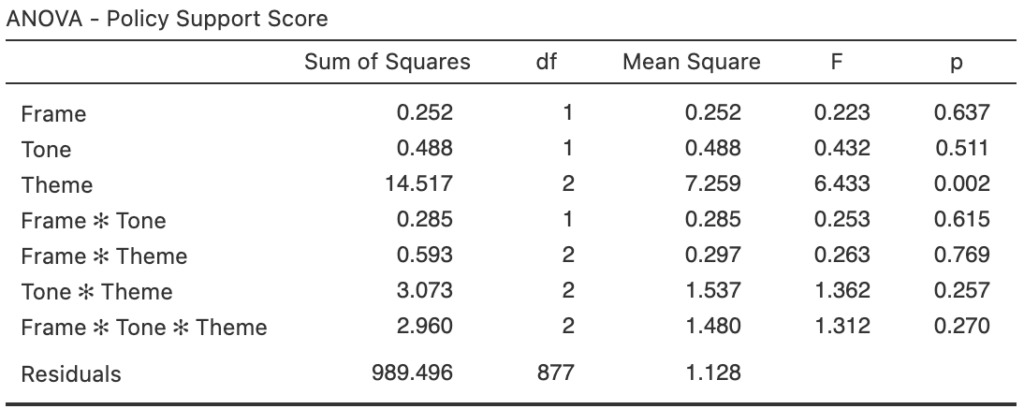
Fig. 2.2.4a: Base participants’ average policy support score P-value analysis across all variable combinations.
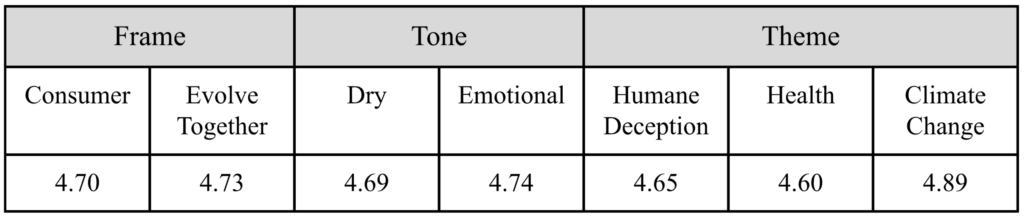
Fig. 2.2.4b: Base participants’ average policy support scores across all variables.
Animal Attitude Score
All Participants
When analyzing the animal attitude scores among all participants, every variable (in addition to all variable interactions) showed statistical significance. In this case, the consumer frame performed significantly better than the evolve together frame (t(3332) = -2.41, p = 0.016, pbonferroni= 0.016). Additionally, the dry tone performed significantly better than the emotional tone (t(3332) = -2.69, p = 0.007, pbonferroni= 0.007) while both the humane deception and climate change themes performed better than the health theme (humane deception*health: t(3332) = 5.77, p < 0.001, pbonferroni< 0.001, climate change*health: t(3332) = -4.42, p < 0.001, pbonferroni< 0.001).
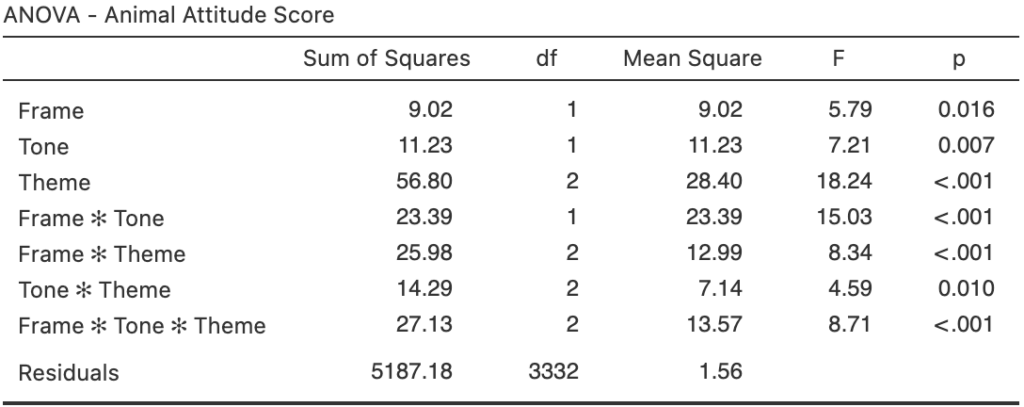
Fig. 2.3.1a: All participants’ average animal attitude score P-value analysis across all variable combinations.

Fig. 2.3.1b: All participants’ average animal attitude scores across all variables.
Opposition
For those in the opposition group, only the frame variable had a significant effect on animal attitude scores. Here, the consumer frame outperformed the evolve together frame (t(365) = 2.84, p = 0.005, pbonferroni= 0.005). Additionally, the emotional tone performed better than the dry tone. However, this difference was not statistically significant. No statistical significance was detected when comparing the theme scores, however the health theme performed marginally better than both other themes.
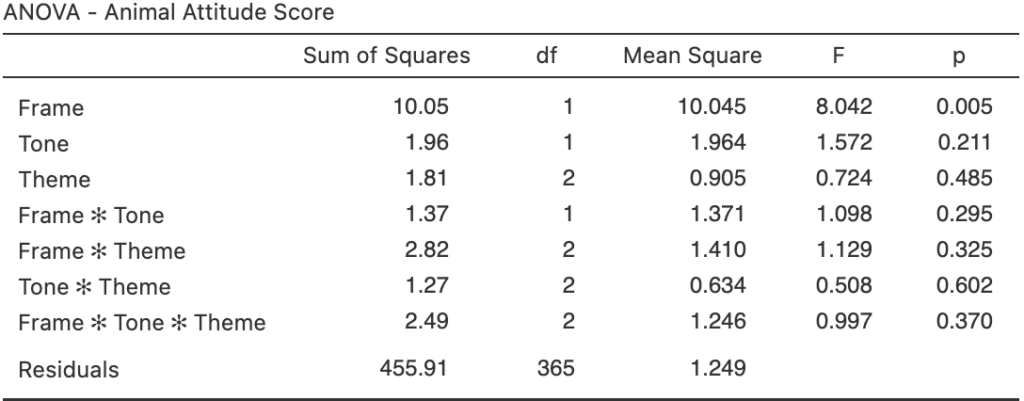
Fig. 2.3.2a: Opposition participants’ average animal attitude score P-value analysis across all variable combinations.
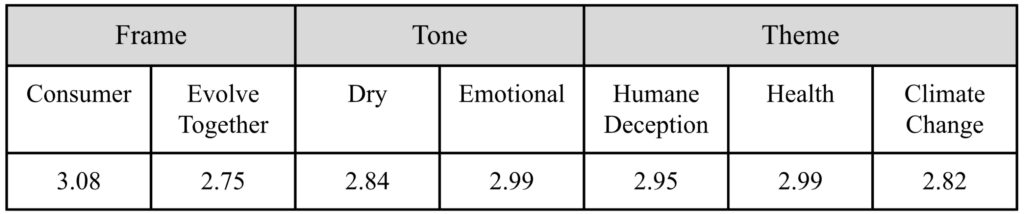
Fig. 2.3.2b: Opposition participants’ average animal attitude scores across all variables.
Persuadable
For those in the persuadable group, only the theme variable had a significant effect on animal attitude scores (at p = 0.028). In this case, the humane deception theme performed significantly better than just the health theme (t(2057) = 2.601, p = 0.009, pbonferroni= 0.028). Additionally, while both the evolve together frame and emotional tone performed better than their variable counterparts, no other statistical significance was detected.
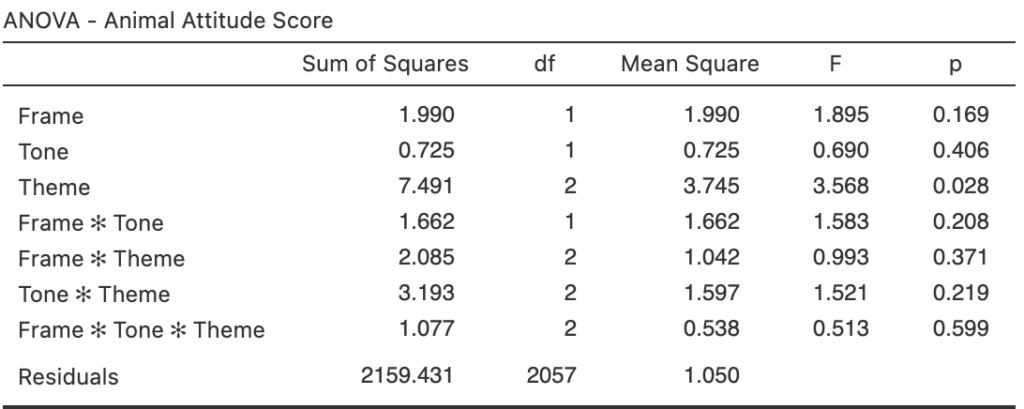
Fig. 2.3.3a: Persuadable participants’ average animal attitude score P-value analysis across all variable combinations.
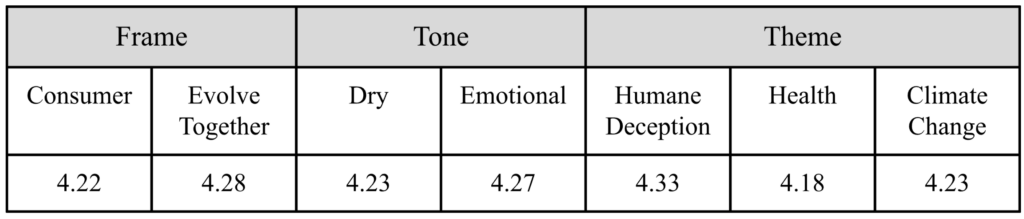
Fig. 2.3.3b: Persuadable participants’ average animal attitude scores across all variables.
Base
No statistical significance was detected when analyzing the variables’ effects on the animal attitude scores of the base group. However, the evolve together frame, dry tone, and humane deception themes performed marginally better than their variable counterparts.
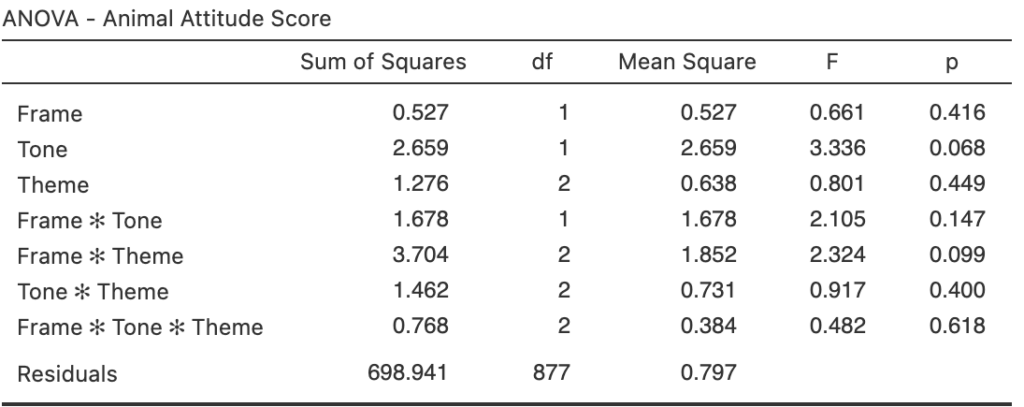
Fig. 2.3.4a: Base participants’ average animal attitude score P-value analysis across all variable combinations.
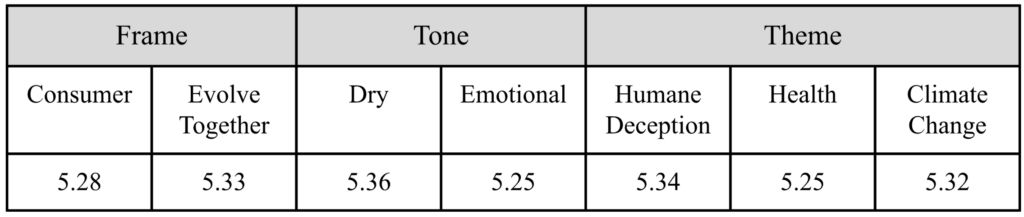
Fig. 2.3.4b: Base participants’ average animal attitude scores across all variables.
Discussion
Our results show that, when comparing the consumer and evolve together frames directly, the consumer frame slightly, and occasionally significantly, was more effective in increasing support for animal-friendly policies and the animal movement as a whole. Interestingly, there seemed to be a toss-up between the dry and emotional tones. While the emotional tone proved to significantly increase the average policy support score among participants, the dry tone proved to significantly increase the average animal attitude score. The humane deception theme frequently produced statistically significantly greater scores than both the health and climate change themes. In some cases, however, the climate change theme was either equal to or outperformed the humane deception theme, particularly among those designated our base. The health theme was consistently the lowest-scoring theme.
This experiment in particular demonstrates the importance of segmenting survey respondents into the sympathetic base, the antagonistic opposition, and the persuadable middle. Different strategies should target different segments (e.g. ballot measures will likely target persuadables while diet change efforts will target the base), and these segments exhibit meaningful differences in how they respond to messaging.
Study 3: Longitudinal Framework Survey Experiment
Materials and Methods
For our final study, we sought to expand upon the findings of our second study while placing extra focus on our main research question– how effective is the civic/evolve together frame compared to the more conventional consumer frame in positively shifting people’s views on animals and the animal movement over time?
Participants
Initially, 1500 participants were recruited at random to take part in our four-minute, five-week long study (titled “Longitudinal 5-Part Policy Study, Part 1” with a weekly incentive of $0.80) via Prolific.co, an online survey panel recruitment tool. All participants were United States residents over the age of 18 who had not participated in any of our previous studies. After rejecting participants for failing attention checks or otherwise returning their submissions, our baseline population was 1406 participants, randomly assigned to the control (n = 269) or one of two treatment groups: evolve together frame (n = 267) or consumer frame (n = 269). Wave 1 saw 1231 returning participants, ending with an attrition rate of 12.4%. Wave 2 saw 1059 returning participants, translating to an attrition rate of 14% between waves 1 and 2. Wave 3 saw 920 returning participants with an attrition rate of 13.1% between waves 2 and 3. With wave 4, our final total number of participants (the responses of whom were used for our analysis), came to 805. This results in an attrition rate of 12.5% between waves 3 and 4, and an overall attrition rate of 42.7%.
The age of the average participant in our final participant pool of 805 was 38.5, while 47.3% identified as female and 52.7% identified as male.
Procedure
The initial wave sought to gather baseline data regarding participants’ various beliefs regarding animals used for food, their intentions to reduce meat consumption, and their support for a hypothetical plant-based procurement policy. During waves 1 through 4, participants in all three groups were presented with op-ed type articles all written around a central theme, but with unique framing for both treatment groups (being the consumer frame or evolve together frame). The themes for each week were as follows: wave 1 detailed industry deception, wave 2 discussed health impacts, wave 3 examined climate change, and wave 4 summarized all arguments made in previous weeks. The control group read op-eds regarding walking and biking in favor of driving, while the consumer frame treatment group’s op-eds urged readers to reduce their meat consumption or “go vegan” while the evolve together frame urged readers to vote in favor of a generic animal-related policy. They were then presented with the same questions asked during the baseline wave, separated into three sections, and answered on a 7-point Likert scale.
Dependent Variables
We measured four dependent variables for all participant groups. These included their policy support score, meat reduction score, movement support score, as well as the average of all three scores.
Analysis
We used the Jamovi (an open-sourced, free data analysis tool similar to SPSS) package “gamlj” to perform a mixed-model analysis of our data. This included fixed, random, and simple effects tests and estimates as well as post-hoc comparisons. We first analyzed the results of all participants in each treatment group, and then further broke each treatment and control group into three smaller groups, based on previously scored demographic questions answered by all participants which aimed to estimate how likely they would be to support our cause (see appendix for additional information). We titled these groups opposition (n = 80), persuadable (n = 523) and base (n = 202).
Results
Average Total Score
All Participants
We found that the average total score among participants across all waves in the evolve together treatment group was significantly higher, on average, than that of the control group [t(520)= 3.29, p = 0.001, pbonferroni = 0.003]. No significant differences were detected when comparing the average scores of both treatment groups [t(524)= -1.09, p = 0.277, pbonferroni = 0.832]. Marginal statistical significance was detected when comparing the average total score between the consumer frame treatment group and control before applying the Bonferroni correction [t(525)= 2.26, p = 0.024, pbonferroni = 0.073].
When comparing average scores between treatment and control groups wave by wave, both treatments proved to produce significantly greater final wave scores compared to the control [Consumer Frame: t(892)= 4.014, p < 0.001, pbonferroni = 0.007, Evolve Together Frame: t(893)= 4.605, p < 0.001, pbonferroni < 0.001]. All other wave-wise comparisons were either not statistically significant, or were marginally significant before accounting for the Bonferroni correction.
Additionally, all three groups’ average total scores raised significantly over the course of the study [Control: t(3208)= -4.163, p < 0.001, pbonferroni = 0.003, Consumer Frame: t(3208)= -11.794, p < 0.001, pbonferroni < 0.001, Evolve Together Frame: t(3208)= -10.717, p < 0.001, pbonferroni < 0.001]. This represents a 19.12% increase in total score for the consumer frame treatment group, a 16.81% increase in total score for the evolve together treatment group, and a 6.43% increase in total score for the control group.
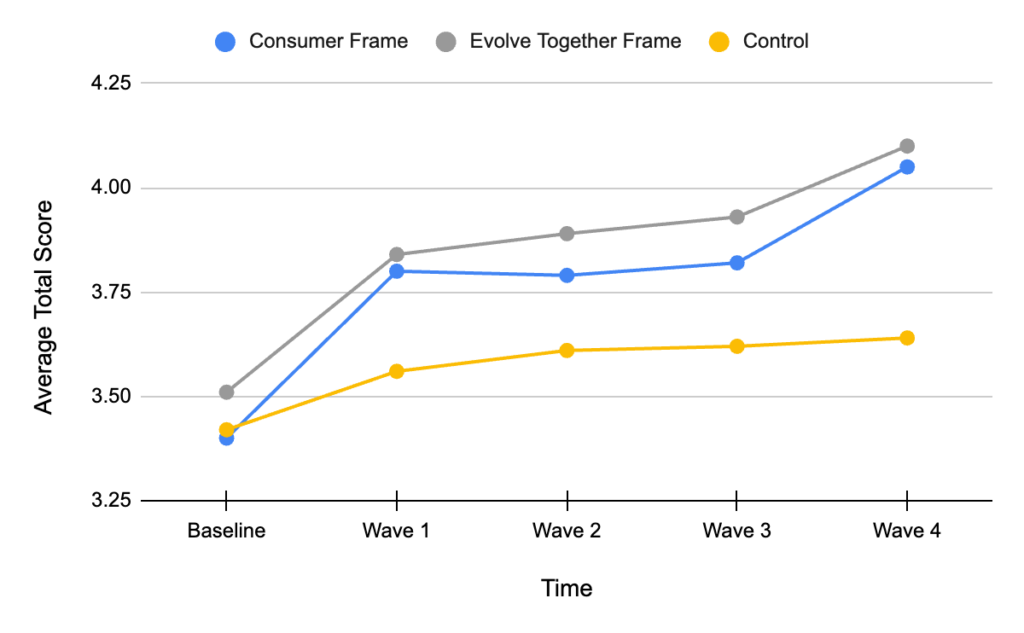
Fig. 3.1.1: Changes in average total score per wave.
Opposition
The average total score among those in our opposition pool of participants was not found to be significantly impacted by either treatment group when compared to the control group’s average [Consumer Frame: t(77.8)= 1.256, p = 0.213, pbonferroni = 0.639, Evolve Together Frame: t(78)= 1.023, p = 0.309, pbonferroni = 0.928]. Nor was any significance detected when comparing the average scores across all waves of both treatment groups [t(78.1)= 0.251, p = 0.802, pbonferroni = 1.000].
However, when comparing the scores wave by wave, the final wave scores of both treatment groups were significantly greater than that of the control group, before the Bonferroni correction was applied [Consumer Frame: t(102)= 2.8819, p = 0.005, pbonferroni = 0.506, Evolve Together Frame: t(103)= 2.7189, p = 0.008, pbonferroni = 0.807].
Additionally, both treatment groups’ average scores raised significantly over the course of the study [Consumer Frame: t(308)= -8.1409, p < 0.001, pbonferroni < 0.001, Evolve Together Frame: t(310)= -7.0000, p < 0.001, pbonferroni < 0.001]. This represents a 31.13% increase in total score for the consumer frame treatment group, a 26.73% increase in total score for the evolve together treatment group, and a 1.40% increase in total score for the control group.
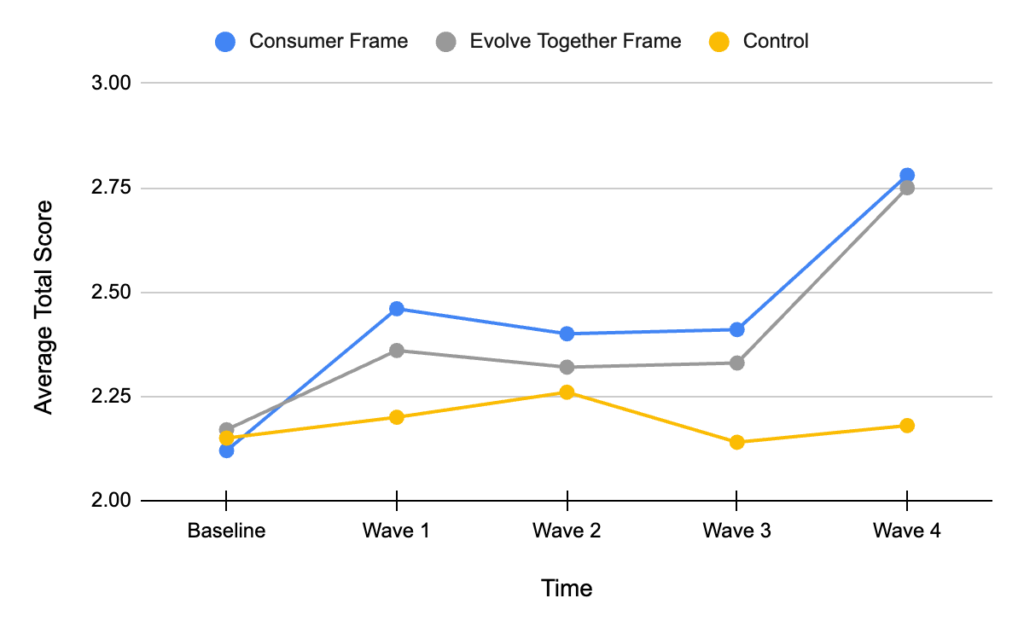
Fig. 3.1.2: Changes in opposition average total score per wave.
Persuadable
We found that the average total score among persuadable participants across all waves in the evolve together treatment group was significantly higher, on average, than that of the control group [t(520)= 4.34, p < 0.001, pbonferroni < 0.001]. Statistical significance in favor of the consumer frame was also detected when comparing the average total scores between the consumer frame treatment group and control [t(520)= 2.61, p = 0.009, pbonferroni = 0.028].
When comparing average scores between treatment and control groups wave by wave, the evolve together frame group proved to have significantly higher scores than the control group at wave 1 [t(693)= 3.8256, p < 0.001, pbonferroni = 0.015], wave 2 [t(693)= 4.0354, p < 0.001, pbonferroni = 0.006], wave 3 [t(693)= 4.3770, p < 0.001, pbonferroni = 0.001], and wave 4 [t(693)= 5.8863, p < 0.001, pbonferroni < 0.001]. Additionally, the consumer frame performed significantly better than the control group at wave 4 [t(693)= 4.5858, p < 0.001, pbonferroni < 0.001].
Finally, all three groups’ average scores raised significantly over the course of the study [Control: t(2080)= -5.5850, p < 0.001, pbonferroni < 0.001, Consumer Frame: t(2080)= -15.5811, p < 0.001, pbonferroni < 0.001, Evolve Together Frame: t(2080)= -15.0736, p < 0.001, pbonferroni < 0.001]. This represents a 20.68% increase in total score for the consumer frame treatment group, a 19.12% increase in total score for the evolve together treatment group, and a 7.52% increase in total score for the control group.
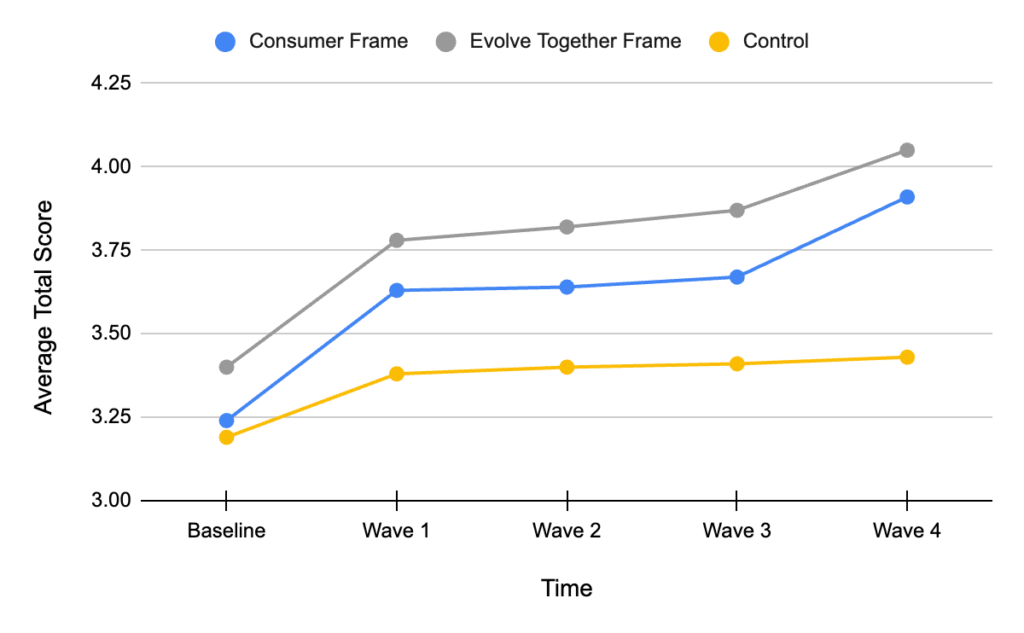
Fig. 3.1.3: Changes in persuadable average total score per wave.
Base
The average total score among those in our base pool of participants was not found to be significantly impacted by either treatment group when compared to the control group’s average [Consumer Frame: t(199)= 1.54338, p= 0.124, pbonferroni = 0.373, Evolve Together Frame: t(199)= 1.51061, p= 0.132, pbonferroni = 0.397.] Nor was any significance detected when comparing the average scores across all waves of both treatment groups [t(199)= 0.00131, p= 0.999, pbonferroni =1.000].
When comparing the scores wave by wave, the score of the consumer frame group was marginally significantly greater than that of the control group, before accounting for the Bonferroni correction at wave 1[t(264)= 2.3696, p = 0.019, pbonferroni = 1.000]. No other statistical significance was detected when comparing scores between all treatment and control groups. However, all three groups’ scores raised significantly over the course of the study [Control: t(783)= -4.4512, p < 0.001, pbonferroni = 0.001, Consumer Frame: t(783)= -8.4956, p < 0.001, pbonferroni < 0.001, Evolve Together Frame: t(783)= -6.8465, p < 0.001, pbonferroni < 0.001]. This represents an 11.82% increase in total score for the consumer frame treatment group, a 9.91% increase in total score for the evolve together treatment group, and a 5.95% increase in total score for the control group.
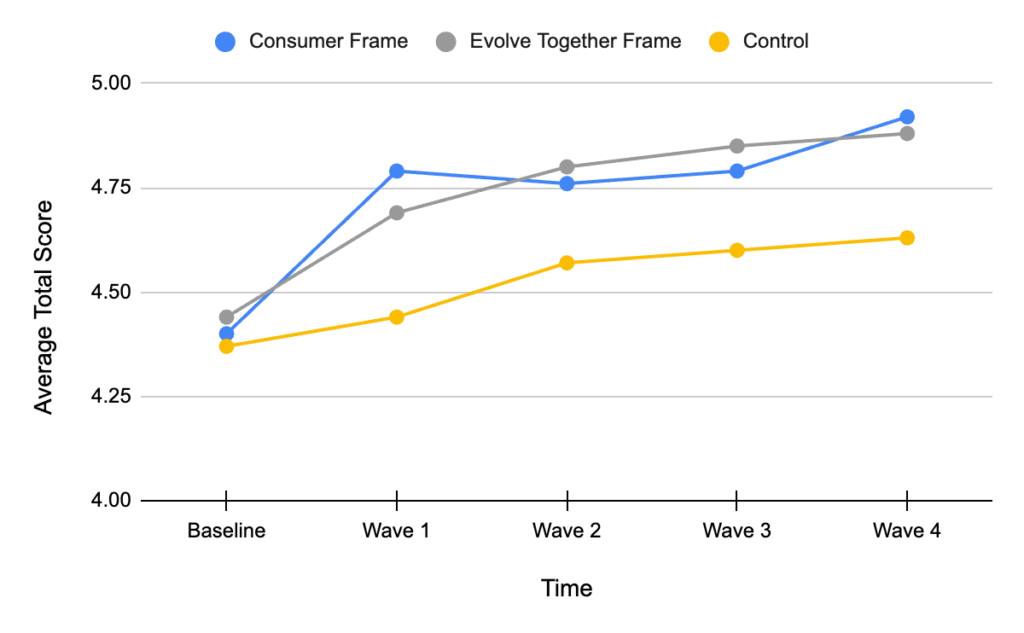
Fig. 3.1.4: Changes in base average total score per wave.
Policy Support Score
All Participants
We found that the average policy support score among participants across all waves in the evolve together treatment group was significantly higher, on average, than that of the control group [t(802)= 5.06, p < 0.001, pbonferroni < 0.001]. Likewise, the average policy support score among participants across all waves in the consumer frame treatment group was significantly higher than that of the control group [t(802)= 4.01, p < 0.001, pbonferroni < 0.001]. No significant difference was detected when comparing the average policy support scores of both treatment groups [t(802)= -1.06, p = 0.291, pbonferroni = 0.874].
When comparing average policy support scores between treatment and control groups wave by wave, both treatments proved to produce significantly (or marginally significantly) greater scores than the control at all waves [Consumer Frame: Wave 1– t(1336)= 4.7074, p < 0.001, pbonferroni < 0.001, Wave 2– t(1336)= 2.1466, p= 0.032, pbonferroni = 1.000, Wave 3– t(1336)= 3.2372, p= 0.001, pbonferroni = 0.130, Wave 4– t(1336)= 8.2868, p < 0.001, pbonferroni < 0.001], [Evolve Together Frame: Wave 1– t(1336)= 4.6722, p < 0.001, pbonferroni < 0.001, Wave 2– t(1336)= 3.7119, p < 0.001, pbonferroni = 0.022, Wave 3– t(1336)= 4.5640, p < 0.001, pbonferroni < 0.001, Wave 4– t(1336)= 8.5602, p < 0.001, pbonferroni < 0.001].
Additionally, all three groups’ policy support scores raised significantly over the course of the study [Control: t(3208)= -4.5006, p < 0.001, pbonferroni < 0.001, Consumer Frame: t(3208)= -21.3222, p < 0.001, pbonferroni < 0.001, Evolve Together Frame: t(3208)= -19.0906, p < 0.001, pbonferroni < 0.001]. This represents a 51.65% increase in policy support score for the consumer frame treatment group, a 43.41% increase in policy support score for the evolve together treatment group, and a 10.36% increase in policy support score for the control group.
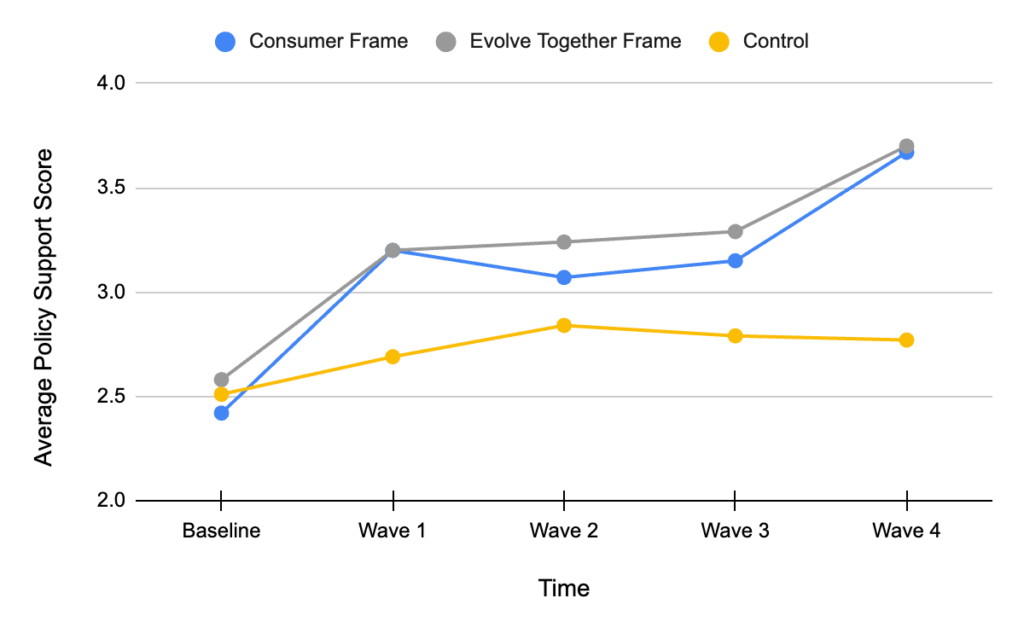
Fig. 3.2.1: Changes in average policy support score per wave.
Opposition
The average policy support score among those in our “opposition” pool of participants was found to be significantly strengthened by both treatment groups when compared to the control group’s average, however the consumer frame proved slightly more effective [Consumer Frame: t(77.4)= 3.124, p= 0.003, pbonferroni = 0.008, Evolve Together Frame: t(78)= 2.709, p= 0.008, pbonferroni = 0.025]. No significance was detected when comparing the average scores across all waves of both treatment groups [t(78)= 0.447, p= 0.656, pbonferroni =1.000].
When comparing the policy support scores of all groups wave by wave, both treatment groups’ scores were significantly greater than that of the control group at wave 4 [Consumer Frame: t(195)= 7.0360, p < 0.001, pbonferroni < 0.001, Evolve Together Frame: t(198)= 7.0019, p < 0.001, pbonferroni < 0.001].
Additionally, both treatment groups’ policy support scores raised significantly over the course of the study [Consumer Frame: t(308)= -10.4037, p < 0.001, pbonferroni < 0.001, Evolve Together Frame: t(311)= -10.5969, p < 0.001, pbonferroni < 0.001]. This represents a 96.20% increase in policy support score for the consumer frame treatment group, a 98.71% increase in policy support score for the evolve together treatment group, and a 1.23% decrease in policy support score for the control group.
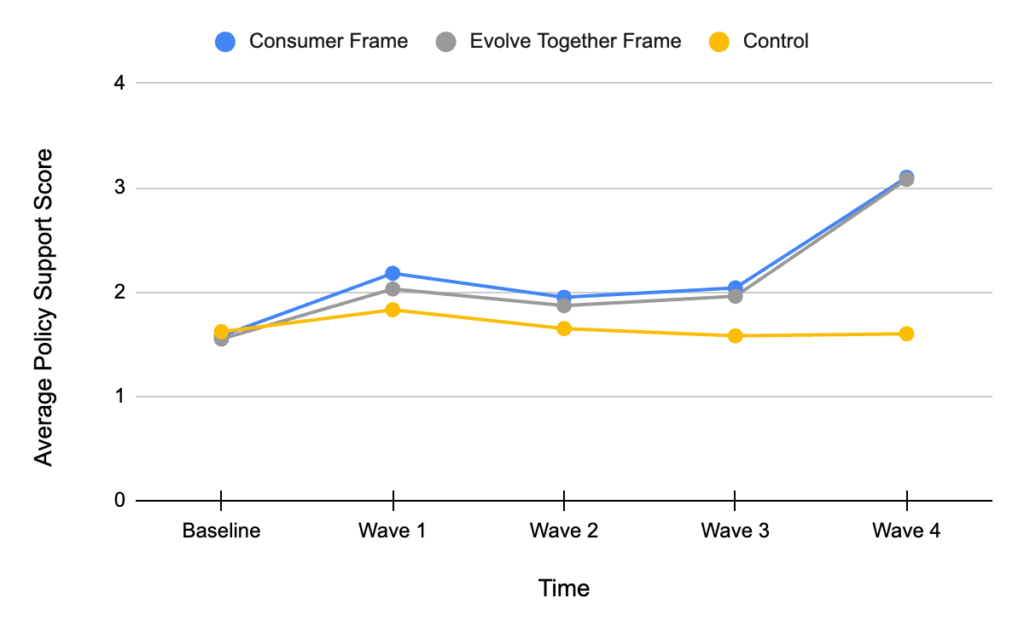
Fig. 3.2.2: Changes in opposition average policy support score per wave.
Persuadable
We found that the average policy support score among persuadable participants across all waves in the evolve together treatment group was significantly higher, on average, than that of the control group [t(520)= 5.96, p < 0.001, pbonferroni < 0.001]. Likewise, the average policy support score among participants across all waves in the consumer frame treatment group was significantly higher, on average, than that of the control group [t(520)= 4.13, p < 0.001, pbonferroni < 0.001].
When comparing average policy support scores between treatment and control groups wave by wave, both treatments proved to produce significantly greater scores than the control at most waves [Consumer Frame: Wave 1– t(1134)= 3.800, p < 0.001, pbonferroni = 0.016, Wave 4– t(1134)= 7.879, p < 0.001, pbonferroni < 0.001], Evolve Together Frame: Wave 1– t(1134)= 5.119, p < 0.001, pbonferroni < 0.001, Wave 2– t(1134)= 4.230, p < 0.001, pbonferroni = 0.003, Wave 3– t(1134)= 4.986, p < 0.001, pbonferroni < 0.001, Wave 4– t(1134)= 8.546, p < 0.001, pbonferroni < 0.001].
Additionally, both treatment groups’ policy support scores raised significantly over the course of the study [Consumer Frame: t(2081)= -15.660, p < 0.001, pbonferroni < 0.001, Evolve Together Frame: t(2081)= -14.422, p < 0.001, pbonferroni < 0.001]. This represents a 55.36% increase in policy support score for the consumer frame treatment group, a 46.83% increase in policy support score for the evolve together treatment group, and a 10.97% increase in policy support score for the control group.
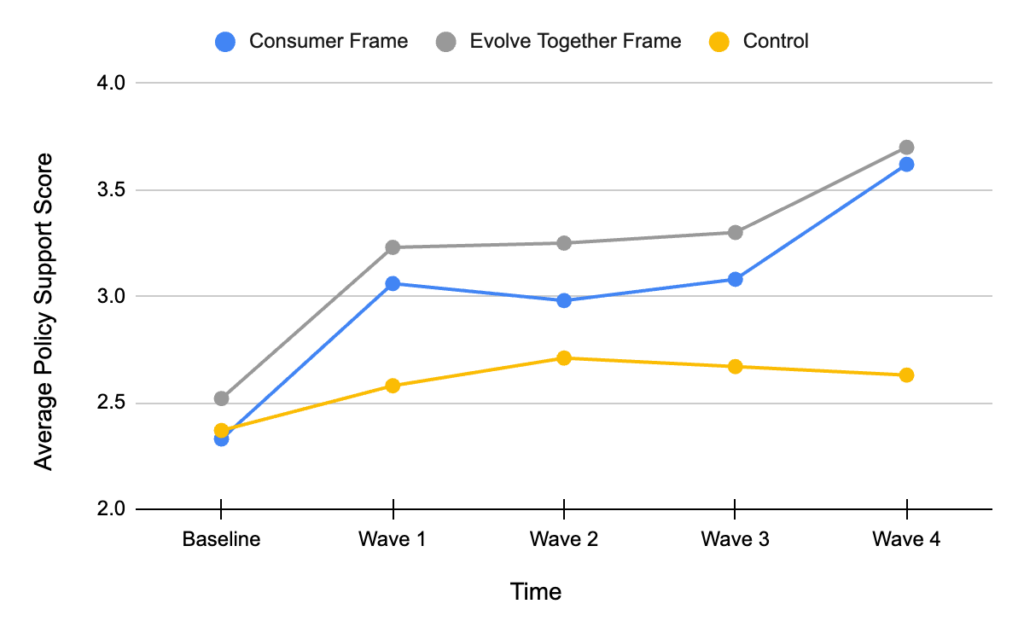
Fig. 3.2.3: Changes in persuadable average policy support score per wave.
Base
The average policy support score among those in our “base” pool of participants was not found to be significantly impacted by either treatment group when compared to the control group’s average [Consumer Frame: t(199)= 1.8982, p= 0.059, pbonferroni = 0.177, Evolve Together Frame: t(199)= 1.8738, p= 0.062, pbonferroni = 0.187]. Nor was any significance detected when comparing the average scores across all waves of both treatment groups [t(198)= -0.0139, p= 0.989, pbonferroni =1.000].
When comparing the policy support scores wave by wave, the score of the consumer frame group was marginally significantly greater than that of the control group at waves 1 [t(396)= 3.4565, p < 0.001, pbonferroni = 0.064] and 4 [t(396)= 2.4380, p = 0.015, pbonferroni = 1.000], before accounting for the Bonferroni correction. The policy support scores of the evolve together frame were also marginally greater than that of the control at waves 3 [t(396)= 1.9913, p = 0.047, pbonferroni = 1.000] and 4 [t(396)= 2.1634, p = 0.031, pbonferroni = 1.000] before accounting for the Bonferroni correction.
Additionally, both treatment groups’ policy support scores raised significantly over the course of the study [Consumer Frame: t(783)= -7.0903, p < 0.001, pbonferroni < 0.001, Evolve Together Frame: t(783)= -5.2582, p < 0.001, pbonferroni < 0.001]. This represents a 32.13% increase in policy support score for the consumer frame treatment group, a 23.60% increase in policy support score for the evolve together treatment group, and an 11.46% increase in policy support score for the control group.
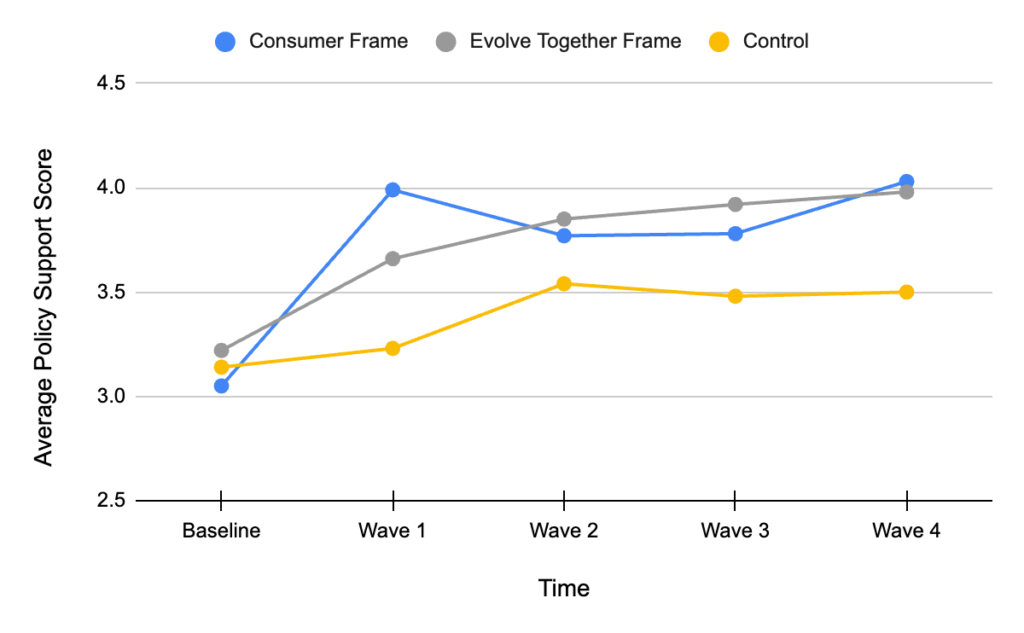
Fig. 3.2.4: Changes in base average policy support score per wave.
Meat Reduction Score
All Participants
The average meat reduction score among all participants and across all waves was not significantly impacted by either treatment group [Consumer Frame: t(803)= 0.718, p= 0.473, pbonferroni = 1.000, Evolve Together Frame: t(803)= 1.385, p = 0.166, pbonferroni = 0.499]. Nor was any significance detected when comparing the average scores across all waves of both treatment groups [t(803)= -0.670, p = 0.503, pbonferroni = 1.000].
However, meat reduction scores did rise significantly between the baseline and wave 4 for all three groups [Control: t(3207)= -4.89792, p < 0.001, pbonferroni < 0.001, Consumer Frame: t(3207)= -8.71987, p < 0.001, pbonferroni < 0.001, Evolve Together Frame: t(3207)= -6.99769, p < 0.001, pbonferroni < 0.001]. This represents a 10.85% increase in meat reduction score for the consumer frame treatment group, an 8.48% increase in meat reduction score for the evolve together treatment group, and a 6.08% increase in meat reduction score for the control group.
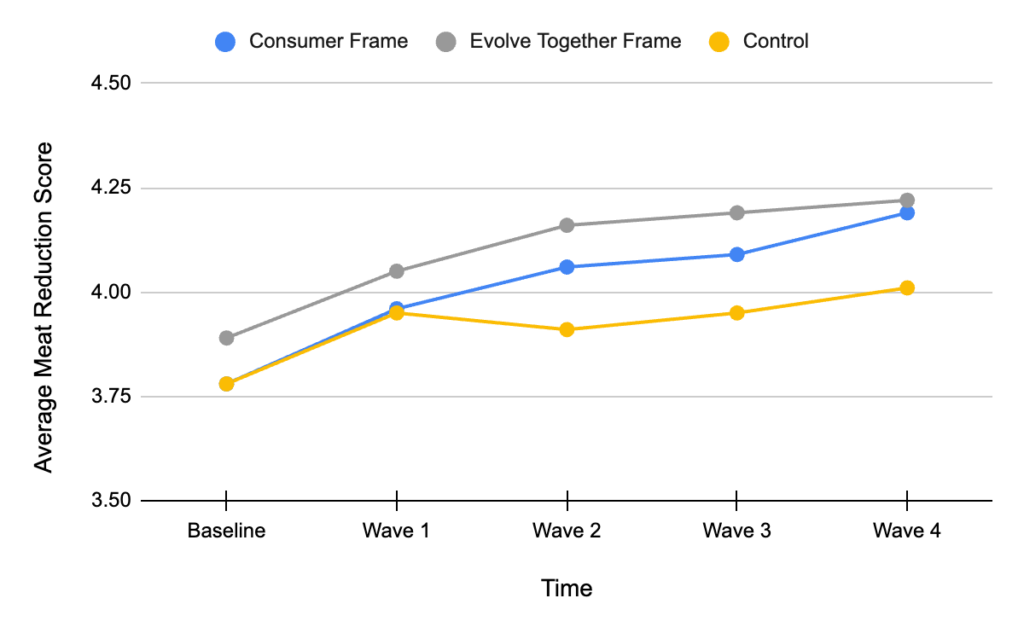
Fig. 3.3.1: Changes in average meat reduction score per wave.
Opposition
The average meat reduction score among participants in the opposition group and across all waves was not significantly impacted by either treatment group [Consumer Frame: t(77.6)= -0.71433, p = 0.477, pbonferroni = 1.000, Evolve Together Frame: t(78.0)= -0.72007, p = 0.474, pbonferroni = 1.000]. Nor was any significance detected when comparing the average scores across all waves of both treatment groups [t(78.1)= 0.00130, p = 0.999, pbonferroni = 1.000].
The consumer frame was the only group whose meat reduction scores increased significantly over the course of the study, before the Bonferroni correction was added [t(308)= -3.1047, p = 0.002, pbonferroni = 0.219]. This represents a 29.24% increase in meat reduction support score for the consumer frame treatment group, a 1.52% increase in meat reduction score for the evolve together treatment group, and a 12.25% increase in meat reduction score for the control group.
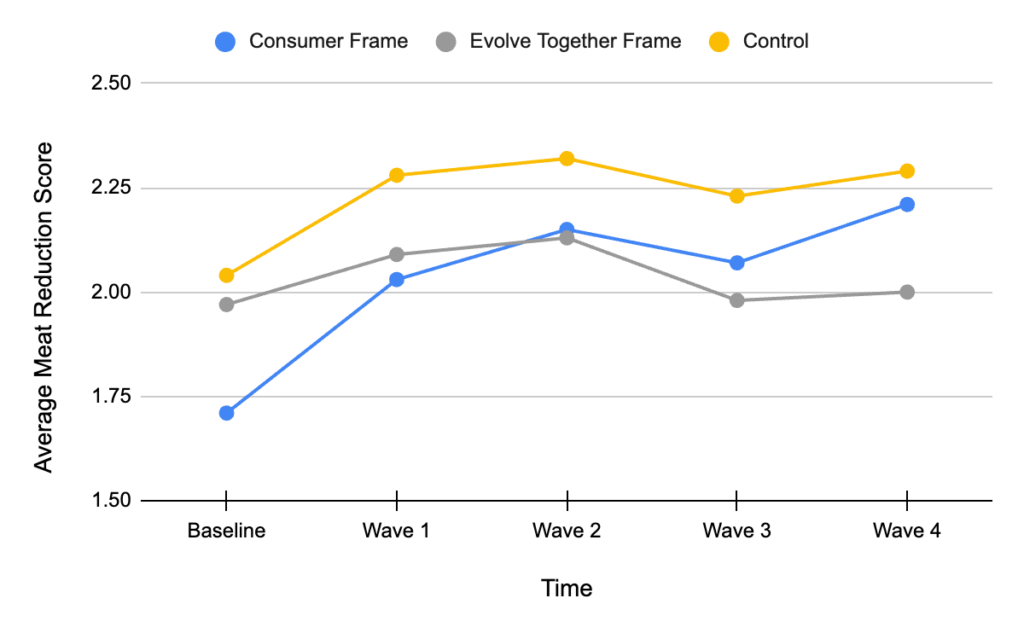
Fig. 3.3.2: Changes in opposition average meat reduction score per wave.
Persuadable
We found that the average meat reduction score among persuadable participants across all waves in the evolve together treatment group was marginally significantly higher, on average, than that of the control group before the addition of the Bonferroni correction [t(520)= 2.40, p = 0.017 pbonferroni = 0.050]. No statistical significance was detected when comparing the average meat reduction scores between treatment groups [t(520)= -1.30, p = 0.195 pbonferroni = 0.586], or between the consumer frame treatment group and the control group [t(520)= 1.11, p = 0.269 pbonferroni = 0.808].
No statistical significance was detected when comparing average meat reduction scores between treatment and control groups wave by wave, after the addition of the Bonferroni correction. However, meat reduction scores did rise significantly between the baseline and wave 4 for all three groups [Control: t(2080)= -3.86329, p < 0.001, pbonferroni = 0.012, Consumer Frame: t(2080)= -6.20239, p < 0.001, pbonferroni < 0.001, Evolve Together Frame: t(2080)= -6.19099, p < 0.001, pbonferroni < 0.001]. This represents a 12.97% increase in meat reduction score for the consumer frame treatment group, a 12.40% increase in meat reduction score for the evolve together treatment group, and an 8.26% increase in meat reduction score for the control group.
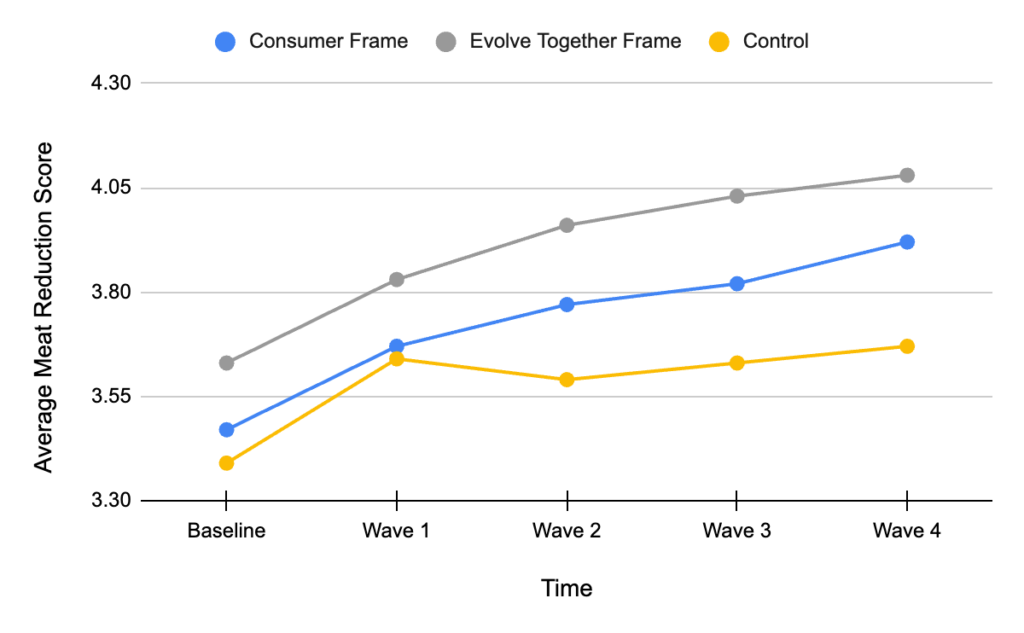
Fig. 3.3.3: Changes in persuadable average meat reduction score per wave.
Base
We found that the average meat reduction score among base participants across all waves in both treatment groups was marginally significantly higher, on average, than that of the control group before the addition of the Bonferroni correction [Consumer Frame: t(199)= 2.2491, p = 0.026, pbonferroni = 0.077, Evolve Together Frame: t(199)= 2.1179, p = 0.035, pbonferroni = 0.106]. No statistical significance was detected when comparing the average meat reduction scores between the treatment groups [t(199)= 0.0838, p = 0.933 pbonferroni = 1.000].
No other statistical significance was detected after the Bonferroni correction was added when comparing the meat reduction scores of all groups wave by wave. However, we detected a 3.80% increase in meat reduction score for the consumer frame treatment group, a 2.36% increase in meat reduction score for the evolve together treatment group, and a 1.90% increase in meat reduction score for the control group.
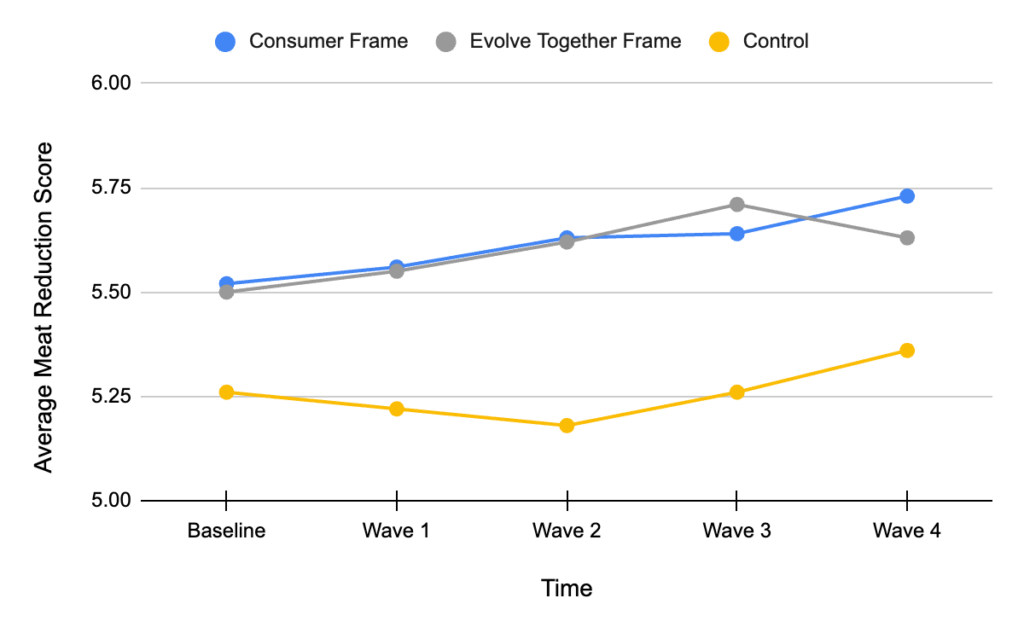
Fig. 3.3.4: Changes in base average meat reduction score per wave.
Movement Support Score
All Participants
The average movement support score among all participants and across all waves was not significantly impacted by either treatment group [Consumer Frame: t(802)= 0.0681, p = 0.946, pbonferroni = 1.000, Evolve Together Frame: t(802)= 0.9763, p = 0.329, pbonferroni = 0.988]. Nor was any significance detected when comparing the movement support scores across all waves of both treatment groups [t(802)= -0.9082, p = 0.364, pbonferroni = 1.000].
However, scores did rise significantly between the baseline and wave 4 for both treatment groups [Consumer Frame: t(3208)= -4.4675, p < 0.001, pbonferroni < 0.001, Evolve Together Frame: t(3208)= -4.6589, p < 0.001, pbonferroni < 0.001], while the control only showed a significant increase before accounting for the Bonferroni correction (t(3208)= -3.1948, p = 0.001, pbonferroni = 0.148). This represents a 6.72% increase in movement support score for the consumer frame treatment group, a 6.83% increase in movement support score for the evolve together treatment group, and a 4.66% increase in movement support score for the control group.
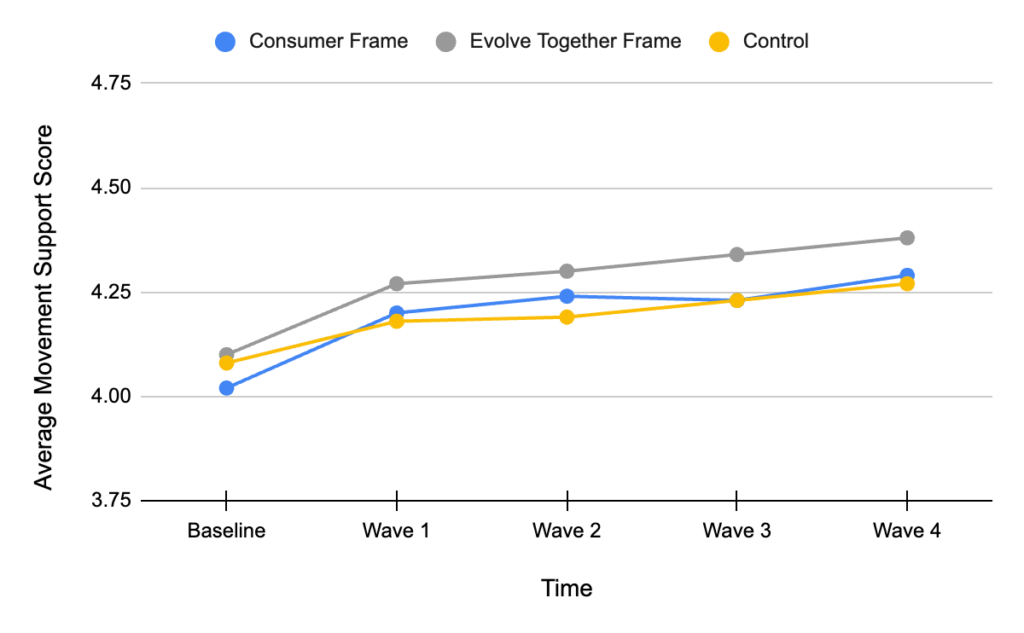
Fig. 3.4.1: Changes in average movement support score.
Opposition
The average movement support score among participants in the opposition group and across all waves was not significantly impacted by either treatment group, [Consumer Frame: t(77.6)= 0.882, p= 0.381, pbonferroni = 1.000, Evolve Together Frame: t(78.0)= 0.644, p = 0.521, pbonferroni = 1.000]. Nor was any significance detected when comparing the average scores across all waves of both treatment groups [t(78.1)= 0.253, p = 0.801, pbonferroni = 1.000].
No other substantial statistical significance was detected after the Bonferroni correction was added when comparing the movement support scores of all groups wave by wave. However, we detected a 1.79% increase in movement support score for the consumer frame treatment group, a 1.77% increase in movement support score for the evolve together treatment group, and a 3.26% decrease in movement support score for the control group.
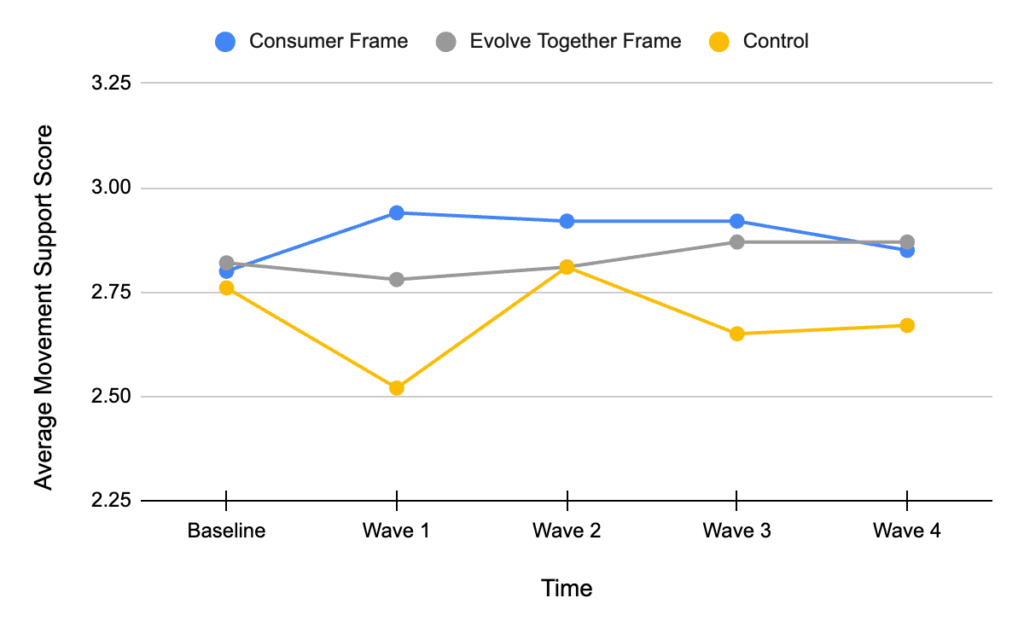
Fig. 3.4.2: Changes in opposition average movement support score.
Persuadable
The average movement support scores among participants in the persuadable group and across all waves were not significantly impacted by either treatment group after the addition of the Bonferroni correction, however the evolve together treatment average movement support score showed statistical significance before the addition of the Bonferroni correction [Consumer Frame: t(520)= 0.838, p = 0.402, pbonferroni = 1.000, Evolve Together Frame: t(520)= 2.379, p = 0.018, pbonferroni = 0.053]. Nor was any significance detected when comparing the average scores across all waves of both treatment groups [t(520)= -1.541, p = 0.124, pbonferroni = 0.372].
No statistical significance was detected when comparing average movement support scores between treatment and control groups wave by wave. However, all three groups’ scores increased significantly between the baseline and final wave [Control: t(2080)= -3.5643, p < 0.039, pbonferroni = 0.039, Consumer Frame: t(2080)= -4.9604, p < 0.001, pbonferroni < 0.001, Evolve Together Frame: t(2080)= -5.5569, p < 0.001, pbonferroni < 0.001]. This represents a 6.94% increase in movement support score for the consumer frame treatment group, a 7.46% increase in movement support score for the evolve together treatment group, and a 4.90% increase in movement support score for the control group.
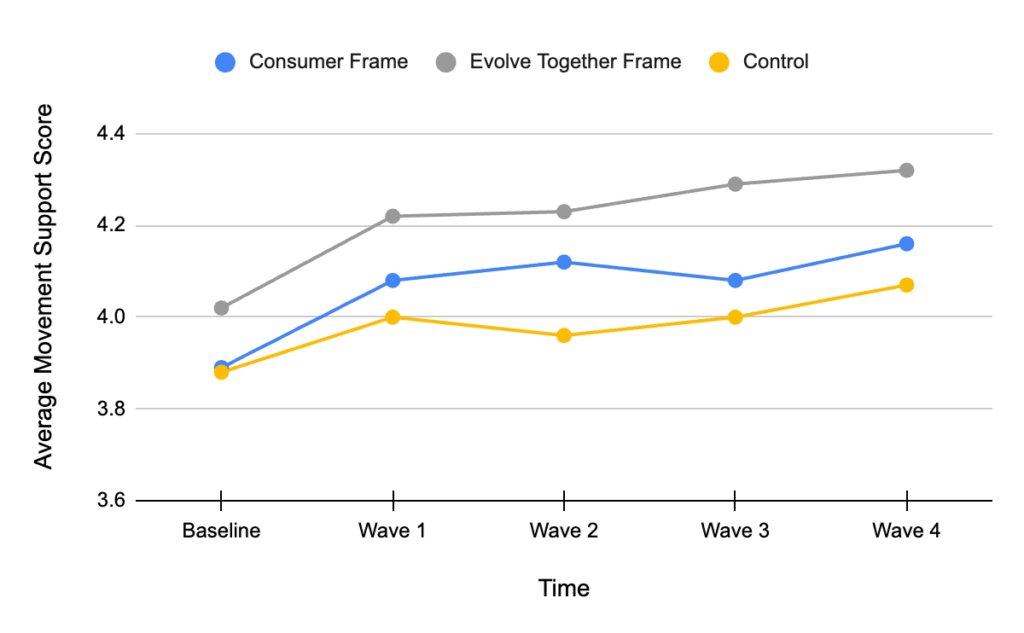
Fig. 3.4.3: Changes in persuadable average movement support score per wave.
Base
We found that the average movement support score among base participants across all waves in both treatment groups was marginally significantly greater, on average, than that of the control group [Consumer Frame: t(199)= -3.0894, p = 0.002, pbonferroni = 0.007, Evolve Together Frame: t(199)= -3.1021, p = 0.002, pbonferroni = 0.007]. No statistical significance was detected when comparing the average movement support scores between treatment groups [t(198)= 0.0740, p= 0.941 pbonferroni = 1.000].
Additionally, no statistical significance was detected when comparing average movement support scores between treatment and control groups wave by wave. However, all three groups’ scores increased significantly between the baseline and final wave [Control: t(783)= -3.5813, p < 0.001, pbonferroni = 0.038, Consumer Frame: t(783)= -3.8723, p < 0.001, pbonferroni = 0.012, Evolve Together Frame: t(783)= -4.0238, p < 0.001, pbonferroni = 0.007]. This represents a 6.31% increase in movement support score for the consumer frame treatment group, a 6.76% increase in movement support score for the evolve together treatment group, and a 5.4% increase in movement support score for the control group.
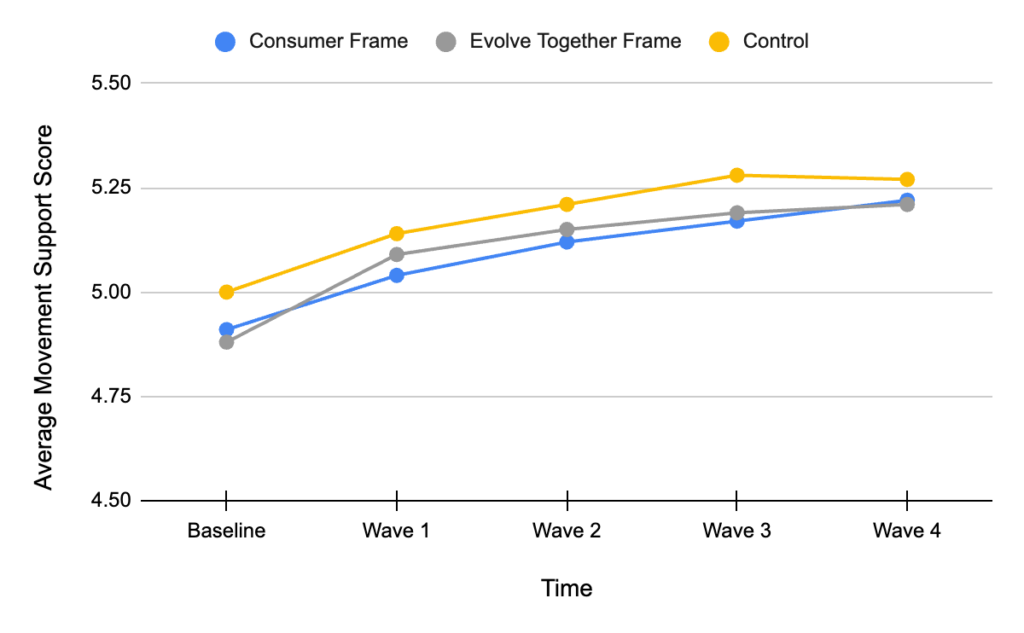
Fig. 3.4.4: Changes in base average movement support score per wave.
Discussion
Our results show that while both the consumer and evolve together frames can have a positive impact on the general population’s support for public plant-based food procurement policies and the animal-freedom movement as a whole, the evolve together frame slightly but consistently outperforms the consumer frame, particularly among those whose demographics make it more likely for them to be persuaded toward supporting our cause. Willingness to reduce meat consumption was somewhat resistant to both frames among all participants, however. It may be that this practice is so deeply ingrained in our society that either frame is simply ineffective in changing this behavior.
Interestingly, while we did not expect scores for the control group to increase (often significantly but to a lesser degree than the treatment groups) over the course of the study as they did, this may indicate that repeated exposure to pro-animal policies alone may be enough to slightly increase their popularity among voters.
Keeping in mind the small sample sizes of both the opposition and base pools of participants, we caution against more widely applying the results specific to these small groups of participants.
General Discussion
Across all studies, participants were shown op-eds in support of a particular pro-animal ballot measure and were then surveyed to gauge their level of support for said measures, in addition to the animal movement as a whole. The first study examined messages with different subject matter, and generally found that focusing on how deceptive the animal agriculture industry is, specifically the lies they tell about the welfare of the animals they exploit, was the most effective at garnering support for a meat-alternative subsidy and the animal movement among all participants. These results were statistically significant among our total sample, as well as our “persuadable” sample.
Our second study placed more emphasis on our main research question, with the addition of looking at how different “tones” of messages alter their effectiveness. This study found little statistical significance between all comparisons, but did find that the consumer frame significantly increased our total sample’s animal attitude score, in addition to our “opposition” sample’s average total score, policy support score, and animal attitude score. In regard to our “tone” findings, the results appeared to be mixed. For example, while the total sample’s policy support score was significantly strengthened by the emotional tone, the total sample’s animal attitude score was significantly strengthened by the dry tone. In line with our first study, the humane deception theme frequently performed significantly better than other frames including our total sample’s average total and animal attitude scores, all scores among our “persuadable” sample. However, the climate change theme performed significantly better than other themes for our “base” sample’s average total and policy support scores.
Our third study expanded upon the method and findings of our second while focusing even further on our core research question and taking place over the course of five weeks. This longitudinal design was employed to see if people’s attitudes towards animals and animal-friendly policies change over time, as opposed to just measuring these attitudes at one snapshot in time. These results contrasted with those of the previous studies and showed that, over time, both the evolve together and consumer frames are effective in changing participant attitudes when compared to the control group. However, the evolve together frame more frequently produced statistically significant score increases when compared to the control group. It should be noted that little statistical significance was found when comparing the scores of both frames directly and that the evolve together frame treatment group’s baseline scores started generally (and non-significantly) higher than both the control and consumer frame treatment groups.
Keeping these combined results in mind, it may be that both the consumer and evolve together frame positively influence people’s attitudes towards animals and their support of animal-friendly policies. However, given our longitudinal study’s results, it may be that the civic frame is slightly more effective at changing attitudes over time, and perhaps helping these attitudes “stick” more than the consumer frame. Additionally, given higher exposure to the more common consumer frame, it may be that this frame is easier to “activate” with a single intervention, whereas the less common civic frame requires more time to be “learned” and may actually be more effective overall. This discrepancy in terms of how often members of the public have been exposed to animal advocacy messages using the consumer frame compared to a civic frame could explain why the civic frame performed more strongly in prior qualitative research involving lengthy interviews and focus groups as compared to the current research involving short survey exposures.
Finally, our results show the importance of shifting message themes depending on the audience. For example, messages with a climate change theme were not as effective in shifting the attitudes of conservative participants, while messages with a “humane deception” theme were generally effective among a wider variety of participants. Because our analysis of the “tone” of messages returned little statistical significance, more research is needed to make any conclusions regarding message tone here.
Limitations and Future Directions
First, this research relied on self-generated survey questions partially informed by the Animal Attitude Scale (Herzog, Betchart & Pittman, 1991). However, few empirically evaluated survey questions and/or scales for measuring attitudes towards farmed animals and pro-animal policies were found prior to designing our studies. Of course, our questions (as is the case with most surveys) were self-report measures which come with their own controversy and potential for error. However, some measures were put in place to limit the potential for social desirability bias within our surveys. Additionally, our “opposition,” “persuadable,” and “base,” subset of our samples from each study were small and did not have the power necessary to apply their results more widely.
Future studies would do well to ensure sufficient subject populations for all sample subsets. Additionally, a longer-term longitudinal study would help the movement gain more data on how effective different messaging frames are in garnering long-term, unwavering support for pro-animal policies. Finally, the creation of an empirically evaluated farmed animal attitude scale and animal policy support scale would be valuable to a wide range of studies, not just those looking to expand upon our present research.
Future research on animal advocacy messaging may also benefit from using our model for segmenting base, persuadable, and opposition subgroups, which revealed important insights about message efficacy that would not have been apparent otherwise. Further research could iterate on this segmentation model to develop a more effective version.
Conclusion
In conclusion, our research has shown that messages with a focus on exposing the deceptive practices of the animal agriculture industry are generally the most effective in garnering support for plant-based procurement policies and the animal movement. However, our results also indicate that different message themes and frames may be more effective for different audiences. Specifically, messages with a climate change theme were not as effective in shifting attitudes among conservative participants, while messages with a “humane deception” theme were generally effective across a wide range of participants.
Our longitudinal study further suggests that both the consumer and evolve together frames can positively influence attitudes towards animals and support for animal-friendly policies, but the evolve together frame may be slightly more effective at changing attitudes over time. Nonetheless, more research is needed to draw firm conclusions on this topic.
In summary, our research provides valuable insights into the most effective message themes and frames for promoting support for animal-friendly policies and the animal movement. By taking into account the differences in audience preferences, we can create more effective and targeted messages that can ultimately help shift attitudes regarding our use of animals.
Bibliography
1 Grummon, Anna H., Aviva A. Musicus, Meg G. Salvia, Anne N. Thorndike, and Eric B. Rimm. 2023. “Impact of Health, Environmental, and Animal Welfare Messages Discouraging Red Meat Consumption: An Online Randomized Experiment.” Journal of the Academy of Nutrition and Dietetics 123 (3): 466-476.e26. https://doi.org/10.1016/j.jand.2022.10.007.
2 Palomo-Vélez, Gonzalo, Joshua M. Tybur, and Mark van Vugt. 2018. “Unsustainable, Unhealthy, or Disgusting? Comparing Different Persuasive Messages against Meat Consumption.” Journal of Environmental Psychology 58 (August): 63–71. https://doi.org/10.1016/j.jenvp.2018.08.002.
3 Ruzgys, Shannon, and Gary J. Pickering. 2020. “Perceptions of Cultured Meat among Youth and Messaging Strategies.” Frontiers in Sustainable Food Systems 4 (August). https://doi.org/10.3389/fsufs.2020.00122.
4 Harris, Jamie, Ali Ladak, and Maya B. Mathur. 2022. “The Effects of Exposure to Information about Animal Welfare Reforms on Animal Farming Opposition: A Randomized Experiment.” Anthrozoös 35 (6): 773–88. https://doi.org/10.1080/08927936.2022.2062868.
5 Mathur, Maya B., Jacob Peacock, David B. Reichling, Janice Nadler, Paul A. Bain, Christopher D. Gardner, and Thomas N. Robinson. 2021. “Interventions to Reduce Meat Consumption by Appealing to Animal Welfare: Meta-Analysis and Evidence-Based Recommendations.” Appetite 164 (September): 105277. https://doi.org/10.1016/j.appet.2021.105277.
6 Hamer, Eva, and Aidan Kankyoku. n.d. “Evolving Together.” Narrative.paxfauna.org. Pax Fauna. Accessed March 11, 2024. https://narrative.paxfauna.org/.
Appendix
- Scoring scheme for base/persuadable/opposition breakdown.
| 1 | 2 | 3 | 4 | 5 | 6 | 7 | |
| Age | >65 | 56-65 | 46-55 | 36-45 | 31-35 | 26-30 | <26 |
| Sex | Male | Female/other | |||||
| Politics generally | 1 (very conservative) | 2 | 3 | 4 | 5 | 6 | 7 (very liberal) |
| Social issues | 1 (very conservative) | 2 | 3 | 4 | 5 | 6 | 7 (very liberal) |
| Economic issues | 1 (very conservative) | 2 | 3 | 4 | 5 | 6 | 7 (very liberal) |
| (3x) Meat reduction | 1 (strongly disagree) | 2 | 3 | 4 | 5 | 6 | 7 (strongly agree) |
Base: Roughly top 25%
Persuadable: Roughly middle 65%
Opposition: Roughly bottom 10%